Observability on NKPPart 3: OpenTelemetry Operator
Tested onNKP 2.19OpenTelemetry Operator 0.114.1Jaeger 2.57.4Istio 1.25.0Lab date On a different version, check the compatibility matrix and the release notes before applying.
Summary: the OpenTelemetry Operator from the NKP catalog instrumented a Python shop with one annotation on the deployment, without touching the code. Within minutes there were traces in Jaeger, metrics in Prometheus and logs with a
trace_id. In Grafana, one click on the failed trace opened the logs of that very purchase in the Loki from Part 1. Along the way, four points of attention that became a checklist: the catalog Jaeger comes with Istio as a dependency, the Prometheus exporter is in the Collector’scontribdistribution, traces are more comfortable to analyze in Grafana and the NKP Prometheus selectsServiceMonitors by a specific label. This is part 3, the last one in the series.
Where we left off
In the previous parts, we turned on logs in the workload cluster and NKP Insights on both clusters. All of that looks at infrastructure. The application is still missing: why a purchase was slow, which service it failed in, which log explains the error.
| Part | Topic |
|---|---|
| 1 | The concepts and what NKP already ships |
| 2 | NKP Insights: the cluster pointing out its own points of attention |
| 3 | OpenTelemetry Operator: traces, metrics and logs from an application (this post) |
The concepts in five minutes
OpenTelemetry standardizes how an application produces metrics, logs and traces. The Collector is the “mail carrier”: it receives the data, processes it and delivers it to one or more destinations. It has three parts:
| Part | Role | In the lab |
|---|---|---|
| Receivers | Where data comes in | OTLP, on ports 4317 (gRPC) and 4318 (HTTP) |
| Processors | What happens along the way | Memory limit and batching |
| Exporters | Where data goes | Traces to Jaeger, metrics to Prometheus |
The OpenTelemetry Operator brings this to Kubernetes with its own resources:
| Resource | What for |
|---|---|
OpenTelemetryCollector | Creates and maintains Collectors, in one of four modes |
Instrumentation | The automatic instrumentation “recipe”: where to send, sampling, language |
TargetAllocator and OpAMPBridge | Distribute scrape targets and manage Collectors remotely |
The Collector modes:
| Mode | When to use |
|---|---|
| Deployment | One central point that receives from every application. What we used. |
| DaemonSet | One per node, to collect local data (node logs, host metrics) |
| Sidecar | One per pod, next to the application |
| StatefulSet | When the Collector needs a stable identity, as with the Target Allocator |
Annotation-based automatic instrumentation exists for Java, Python, Node.js, .NET and Go. For the first four, the operator injects the libraries into the pod; Go uses a different mechanism.
What had to be enabled
Goal: get the operator, a destination for traces and a Collector into the workload cluster.
OpenTelemetry Operator
In the catalog, it is Nutanix Supported but not part of the core platform. That is why its Enable screen has a version selector (0.102.0 and 0.114.1 were available), which platform apps do not have.
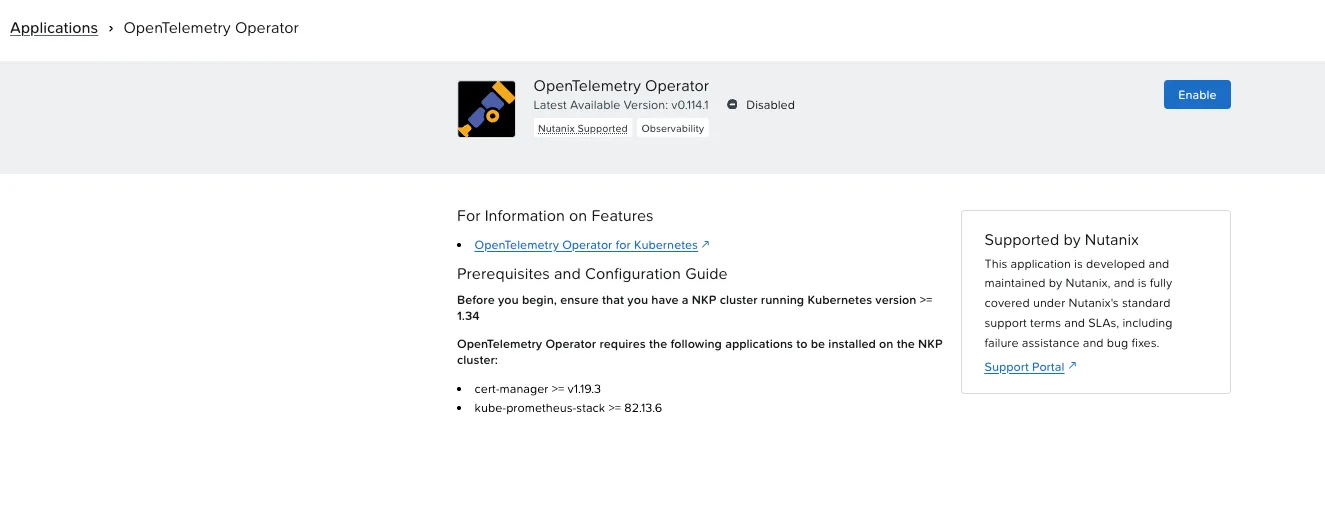
| Declared prerequisite | In the lab |
|---|---|
| Kubernetes 1.34 or later | 1.36.2 |
| cert-manager 1.19.3 or later | 1.20.3, already installed |
| kube-prometheus-stack 82.13.6 or later | already installed |
Jaeger, with Istio as a dependency
Jaeger 2.57.4 is in the catalog, in the Service Mesh category. When I enabled it, NKP warned about a missing dependency: Istio-Helm Service Mesh.
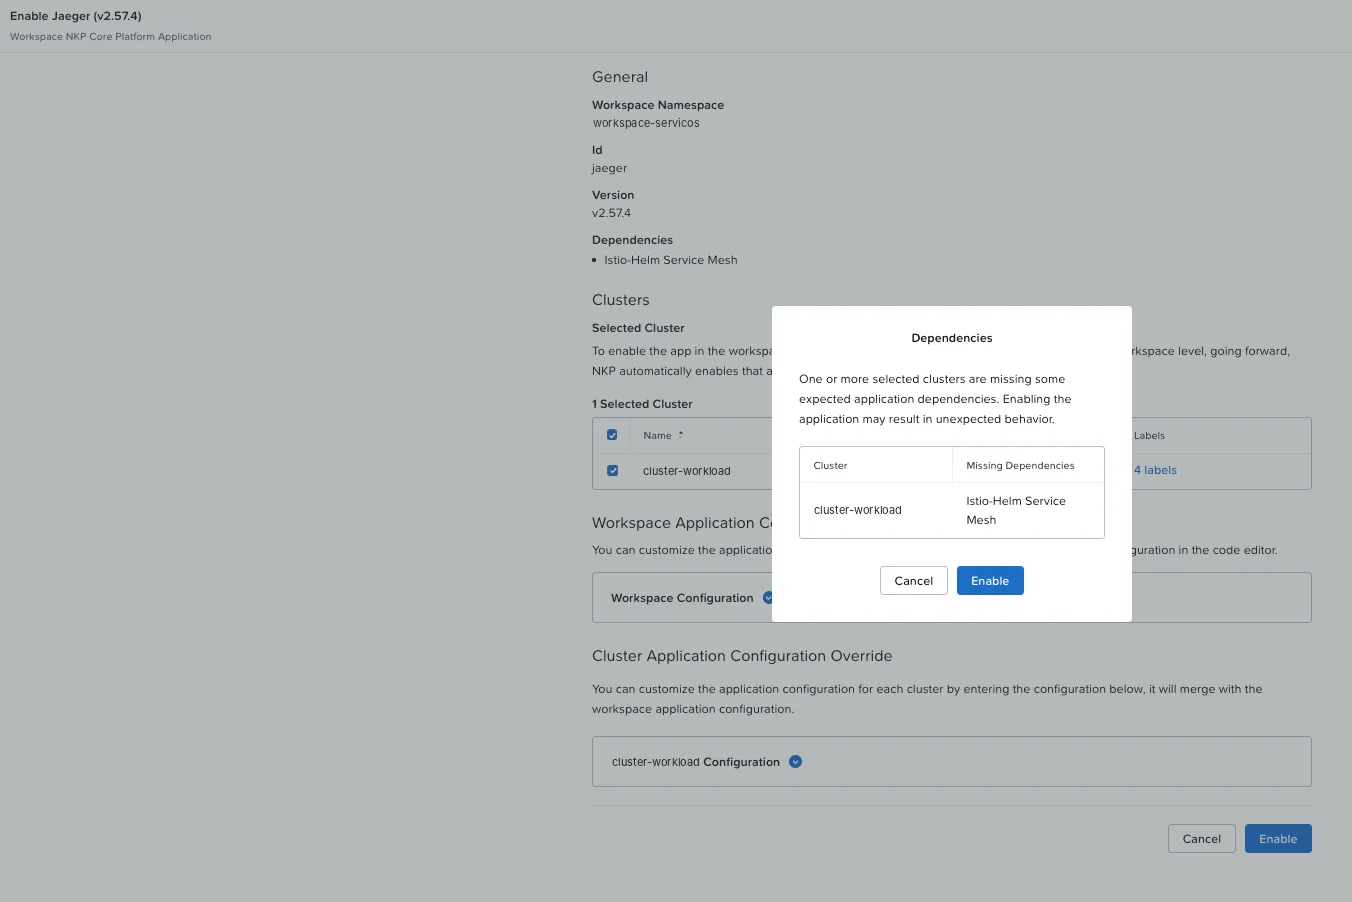
For OpenTelemetry, Jaeger does not need Istio; the dependency exists because NKP positions Jaeger to show service mesh traces. This time I followed the dependency warning, as I recommended in Part 1. But Istio installs istio-cni on every node, and the cluster uses Cilium for networking. Before going on, I checked whether the two could coexist:
$ kubectl -n kube-system get cm cilium-config -o jsonpath='{.data.cni-exclusive}'falsefalse means Cilium accepts another chained network plugin. In about six minutes everything was up, with all system pods healthy:
| Component | What came up |
|---|---|
| Istio 1.25.0 | istiod (2), gateway (2), istio-cni (6, one per node); ztunnel had no pods |
| Jaeger | Jaeger Operator and a running instance, in the istio-system namespace |
| OpenTelemetry Operator | Operator in the opentelemetry namespace and 5 new CRDs |
And a plus: Kommander already publishes the Jaeger UI at https://lab.example.local/dkp/jaeger/, behind the same NKP login.
Best practice: choose the trace backend by your goal
Istio touches node networking, and in the lab it coexisted with Cilium with no conflict. If the goal is only application traces, also consider installing a trace backend directly, without the service mesh; if a service mesh is already in the plans, the catalog Jaeger delivers both together.
The Collector
The Collector receives OTLP and delivers traces to Jaeger and metrics to an endpoint that Prometheus scrapes:
apiVersion: opentelemetry.io/v1beta1kind: OpenTelemetryCollectormetadata: name: otel namespace: observabilityspec: mode: deployment # the default image (otelcol-k8s) does not have the prometheus exporter image: ghcr.io/open-telemetry/opentelemetry-collector-releases/opentelemetry-collector-contrib:0.152.1 config: receivers: otlp: protocols: grpc: {endpoint: 0.0.0.0:4317} http: {endpoint: 0.0.0.0:4318} processors: memory_limiter: {check_interval: 1s, limit_percentage: 80, spike_limit_percentage: 25} batch: {} exporters: otlp_grpc/jaeger: endpoint: jaeger-jaeger-operator-jaeger-collector.istio-system.svc.cluster.local:4317 tls: {insecure: true} prometheus: endpoint: 0.0.0.0:8889 resource_to_telemetry_conversion: {enabled: true} service: pipelines: traces: {receivers: [otlp], processors: [memory_limiter, batch], exporters: [otlp_grpc/jaeger]} metrics: {receivers: [otlp], processors: [memory_limiter, batch], exporters: [prometheus]}My first version did not have the image line, and the pod went into a crashloop, with a message that already points to the adjustment:
Error: failed to get config: ... 'exporters' unknown type: "prometheus" for id: "prometheus"(valid values: [nop otlp_grpc otlp otlphttp loadbalancing debug otlp_http file otelarrow])By default the operator uses the otelcol-k8s distribution, which is leaner, with OTLP and the essential components; the Prometheus exporter is in contrib. The message itself lists what is available. With the contrib distribution image, the Collector started right away. A detail worth knowing: NKP Insights from Part 2 recorded this crashloop about two minutes later, before I investigated.
Check the distribution before writing the configuration
otelcol-k8s is light and covers OTLP, but many receivers and exporters only exist in contrib. Pick the image based on the components your configuration uses.
The sample application
A shop with two Python (Flask) services: loja (shop) takes the purchase and queries estoque (inventory), which fails on purpose 10% of the time. A third pod, cliente (client), makes a purchase every two seconds. This is the shop code, with no OpenTelemetry lines at all:
import logging, random, os, requestsfrom flask import Flask, jsonifyapp = Flask(__name__)log = logging.getLogger("loja")BACKEND = os.environ.get("BACKEND", "http://estoque:8080")ITENS = ["teclado", "monitor", "mouse", "headset"]
@app.route("/comprar")def comprar():    item = random.choice(ITENS)    r = requests.get(f"{BACKEND}/estoque/{item}", timeout=2)    if r.status_code != 200:        log.warning("compra de %s falhou: estoque respondeu %s", item, r.status_code)        return jsonify(item=item, status="indisponivel"), 502    log.info("compra de %s ok (%s em estoque)", item, r.json()["quantidade"])    return jsonify(item=item, status="ok")
Without instrumentation, the shop log was just the web server’s access line:
198.51.100.36 - - [26/Oct/2026 15:27:26] "GET /comprar HTTP/1.1" 200 -Instrumenting without touching the code
There are two actions. The first is the recipe, an Instrumentation resource in the application’s namespace:
apiVersion: opentelemetry.io/v1alpha1kind: Instrumentationmetadata: name: auto namespace: demospec: exporter: endpoint: http://otel-collector.observability.svc.cluster.local:4318 propagators: [tracecontext, baggage] sampler: type: parentbased_traceidratio argument: "1" python: env: - {name: OTEL_PYTHON_LOG_CORRELATION, value: "true"}The second is one annotation on the deployment template:
kubectl -n demo patch deploy loja --type merge -p \ '{"spec":{"template":{"metadata":{"annotations":{"instrumentation.opentelemetry.io/inject-python":"true"}}}}}'The pod was recreated and the operator did the rest on its own:
| What the operator injected | Example |
|---|---|
| An init container | opentelemetry-auto-instrumentation-python (image autoinstrumentation-python:0.63b1), which copies the libraries into the pod |
Extended PYTHONPATH | Keeping the path the application already used |
About 15 OTEL_* variables | OTEL_SERVICE_NAME=loja (taken from the deployment name), endpoint, protocol, sampling |
| Kubernetes attributes | namespace, deployment, ReplicaSet, pod and node |
And the shop log changed:
INFO [loja] [loja.py:14] [trace_id=a2f2d6259a11b0e7ef0bf91290b751ac span_id=efdcaa454b4a1f8f resource.service.name=loja trace_sampled=True] - compra de mouse ok (6 em estoque)Every message now carries the purchase’s trace_id. The web server’s access lines show trace_id=0, because they are written after the request ends.
The version the operator infers
The service.version attribute came out as 3.12-slim, the Python image tag. The operator uses the image tag as the version; in a real application, that tag is usually the app version.
The traces
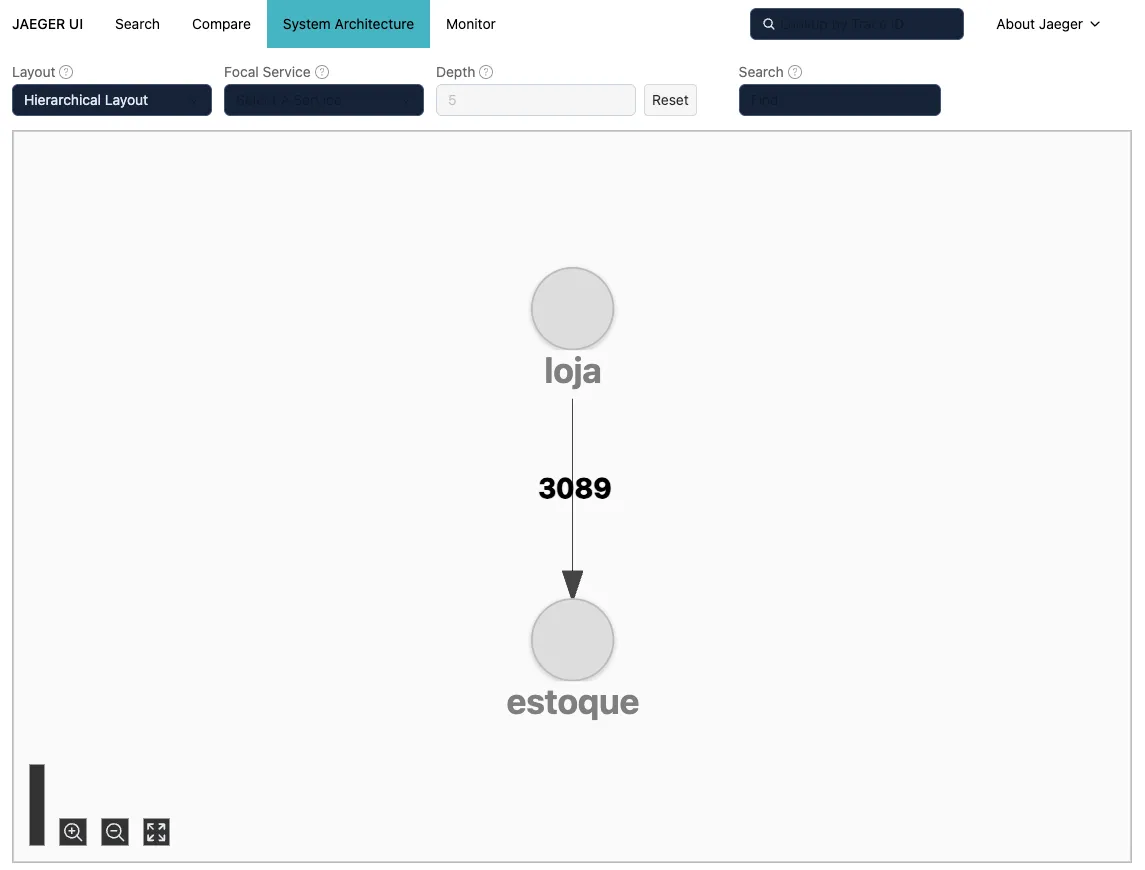
In Jaeger, each purchase became a trace with three spans: the request in the shop, the outgoing HTTP call and the request in the inventory service. The dependency map was drawn on its own, from the traces:
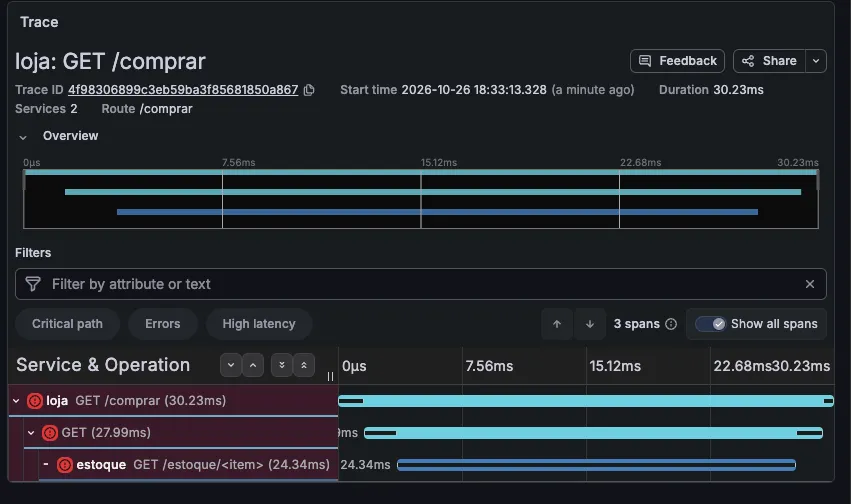
To analyze the traces, I preferred Grafana Logging, which already has Loki and puts trace and log side by side. The Jaeger UI in this version has low contrast (light text on a light background from the first login, in both light and dark mode), and Grafana took care of that too. I added Jaeger as a data source, pointing at the internal query service:
http://jaeger-jaeger-operator-jaeger-query.istio-system.svc.cluster.local:16686/dkp/jaegerIn Grafana, the same failed trace is much easier to read:
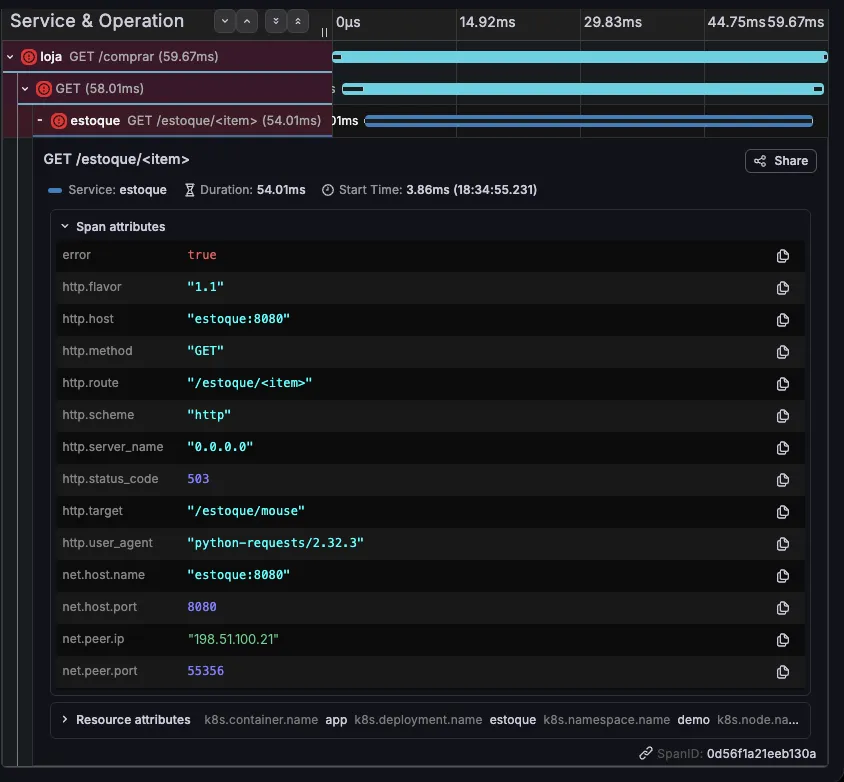
And the inventory span shows the complete failure, with no instrumentation code at all:
From trace to log, in one click
In the Jaeger data source, the Trace to logs section links traces to Loki:
| Field | Value |
|---|---|
| Data source | Loki |
| Span start / end time shift | -1m / 1m |
| Tags | k8s.namespace.name as namespace |
| Filter by trace ID | on |
The tag mapping is the detail that makes it work: in the trace the attribute is called k8s.namespace.name; in Loki, the label is called namespace.
With that, the span gets a Logs for this span button. One click, and Grafana opens Loki alongside, filtered by trace_id:
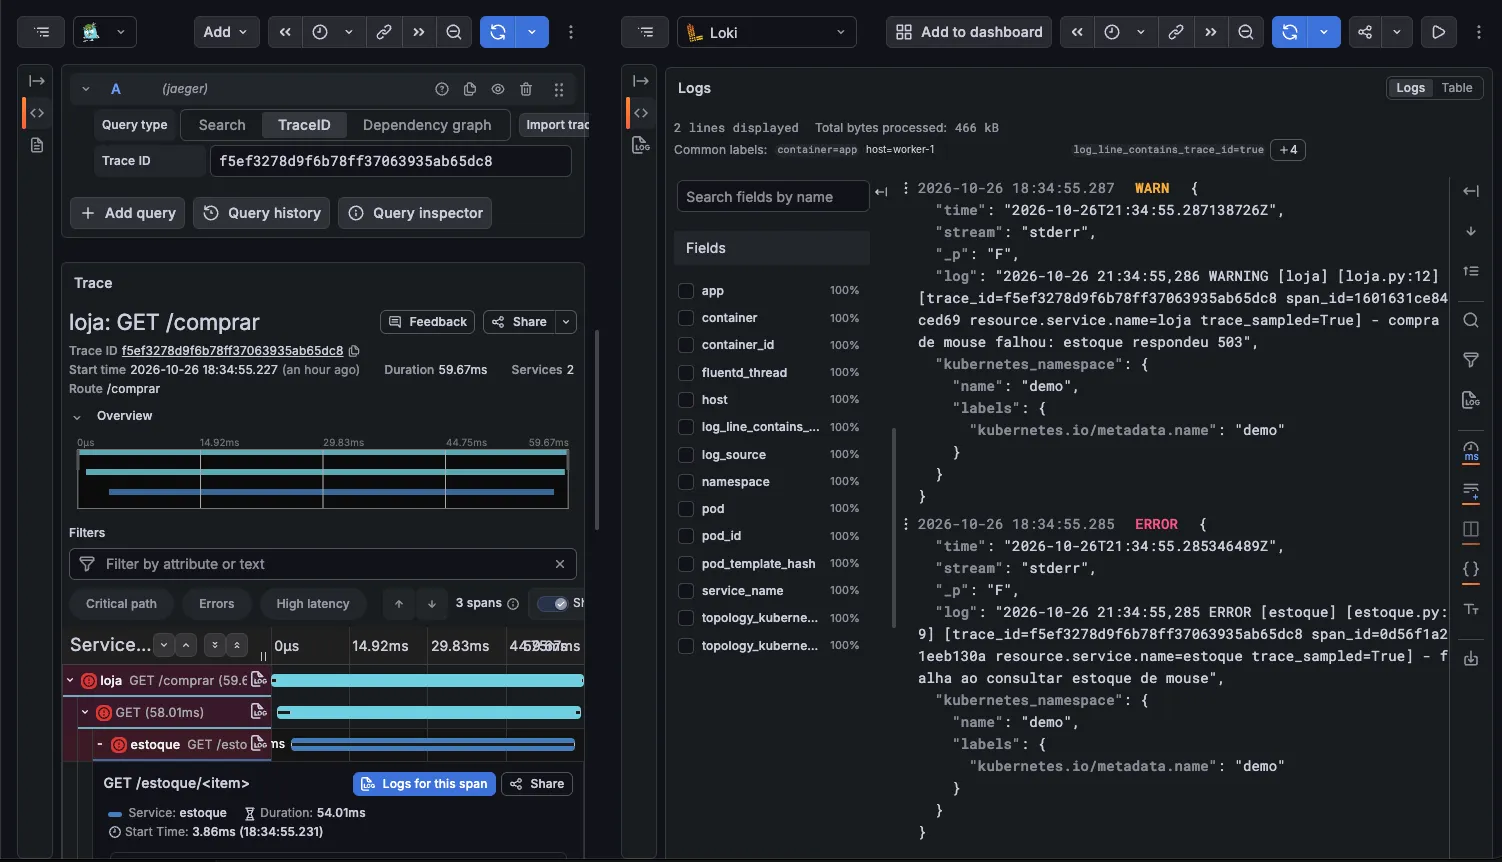
Two lines, the whole story of an error:
ERROR [estoque] [trace_id=f5ef3278...] - falha ao consultar estoque de mouseWARN [loja] [trace_id=f5ef3278...] - compra de mouse falhou: estoque respondeu 503The client asked for a mouse, the shop queried the inventory, the inventory failed (“failed to query mouse stock”) and the shop logged it (“mouse purchase failed: inventory returned 503”). The logs came through the Part 1 stack (Fluent Bit, Fluentd and Loki); the trace, through this part’s stack. The trace_id links them.
The metrics
The third pillar was still missing. The Collector publishes metrics on port 8889, and a ServiceMonitor tells Prometheus to scrape them. For the NKP Prometheus to scrape them, one configuration detail is needed:
$ kubectl get prometheus -A -o jsonpath='{.items[*].spec.serviceMonitorSelector}'{"matchLabels":{"prometheus.kommander.d2iq.io/select":"true"}}The NKP Prometheus selects ServiceMonitors by the label prometheus.kommander.d2iq.io/select: "true", which makes explicit what it scrapes. Examples on the internet use release: kube-prometheus-stack, which is not selected here: without the NKP label, the query comes back empty with no error message. It is worth adding the label from the first manifest.
apiVersion: monitoring.coreos.com/v1kind: ServiceMonitormetadata: name: otel-prom namespace: observability labels: {prometheus.kommander.d2iq.io/select: "true"}spec: selector: {matchLabels: {app: otel-prom}} endpoints: - {port: prom, interval: 30s}With the right label, the metrics showed up in about a minute:
sum by (service_name, http_status_code) (rate(http_server_duration_milliseconds_count{service_name=~"loja|estoque"}[5m]))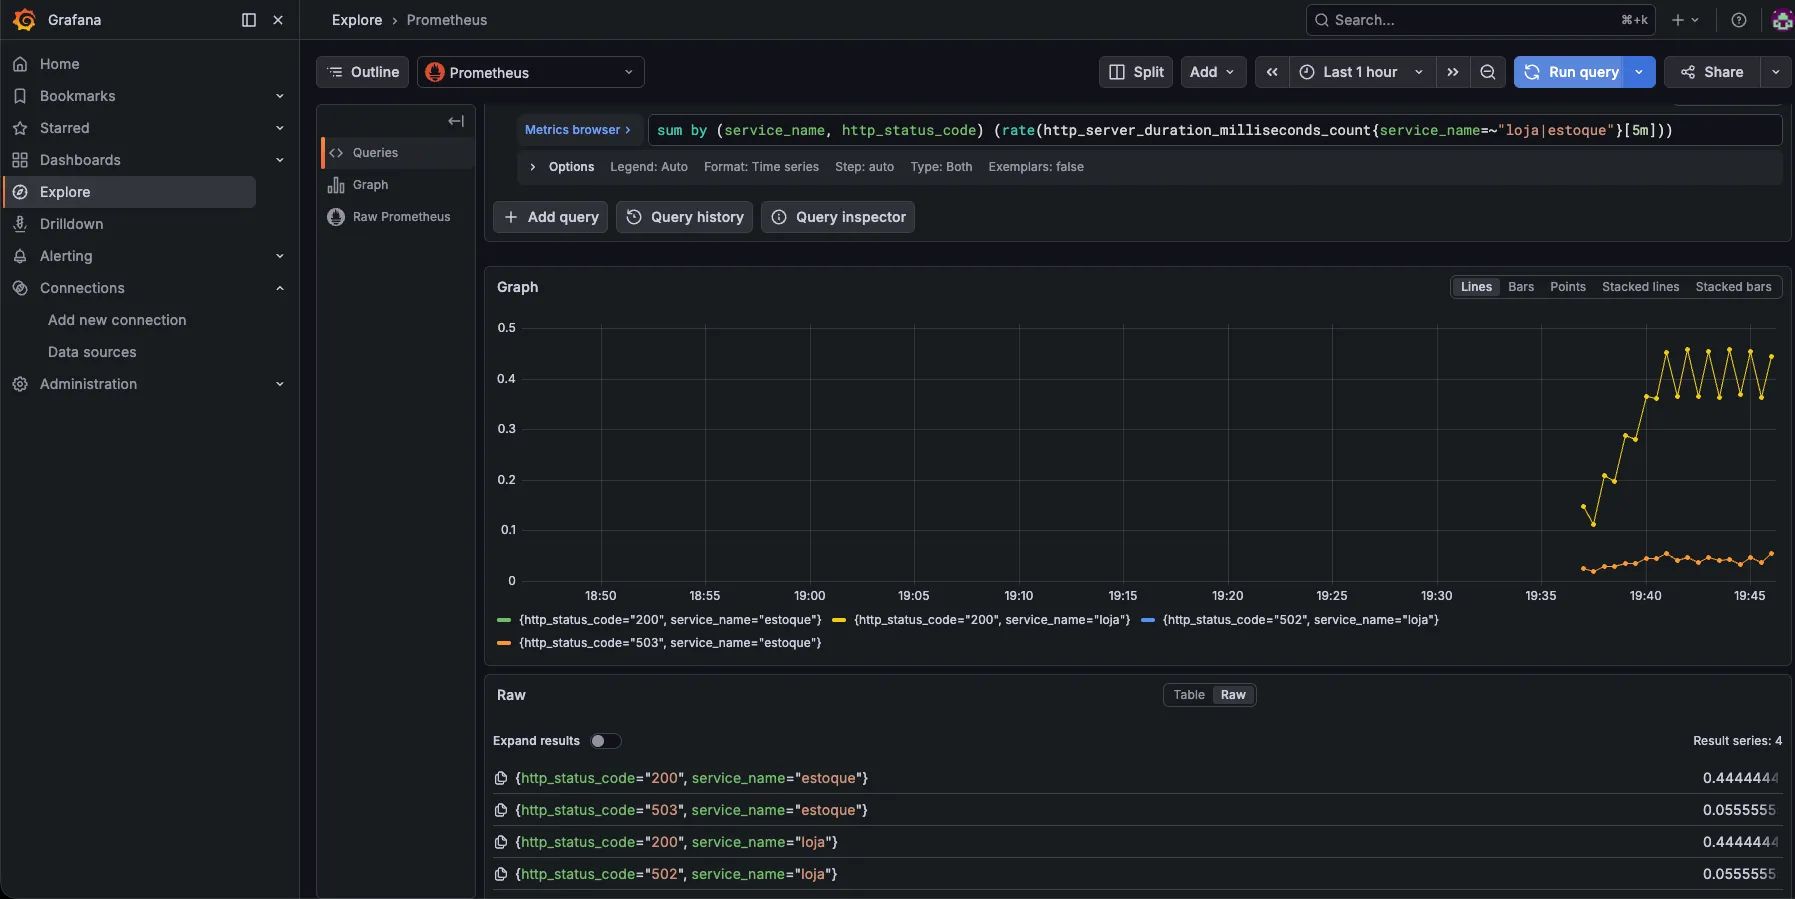
| Metric | Value |
|---|---|
| Inventory, 200 responses | 0.44 per second |
| Inventory, 503 responses | 0.056 per second, about 11%: the intentional failure |
| Inventory p95 latency | about 240 ms |
| Shop p95 latency | about 245 ms, because it includes the call to inventory |
That is the RED method from Part 1 (rate, errors and duration) coming out of the application with no new code.
The same failure, from every angle
| Pillar | What it showed |
|---|---|
| Metrics | 11% of 503 responses from inventory |
| Traces | The inventory span with an error, 503 and /estoque/mouse |
| Logs | “failed to query mouse stock”, opened straight from the trace |
| NKP Insights | The Collector crashloop, detected on its own |
The cost of all this
At the start of the series, reserved CPU (requests) in the workload cluster was 27.1%. After Ceph, logs, Insights, Istio, Jaeger and OpenTelemetry, it reached 72.5%, with CPU limits at 95%. It is a lab cluster, with 8-vCPU workers, but the message applies to any environment: observability goes into sizing from the start.
What I learned
- Automatic instrumentation really works: one annotation, no code changes, and the application starts emitting correlated traces, metrics and logs.
- The catalog Jaeger comes with Istio as a dependency. Check chaining with Cilium (
cni-exclusive=false) and choose the trace backend by your goal. - Choose the Collector distribution by the components in your configuration. The default one is lean; the Prometheus exporter and many others are in
contrib. - The NKP Prometheus selects
ServiceMonitors by theprometheus.kommander.d2iq.io/select: "true"label. Use it from the first manifest. - The value is in the correlation:
trace_idin the log and “Trace to logs” in Grafana turn three tools into a single investigation. - Plan the resources from the start: the cluster’s reserved CPU went from 27.1% to 72.5% over the series, nearly three times as much.
OpenTelemetry on NKP checklist
- cert-manager and kube-prometheus-stack at the required versions
- OpenTelemetry Operator enabled, with the chosen version
- Trace destination decided (catalog Jaeger with Istio, or another backend)
- Collector on a distribution that has the configuration’s components
-
ServiceMonitorwith theprometheus.kommander.d2iq.io/select: "true"label -
Instrumentationper namespace, with sampling defined - Instrumentation annotation on the deployments
- Log correlation on and “Trace to logs” configured in Grafana
- Sampling below 100% in production, to control volume and cost
What I haven’t tested yet
- A real Alertmanager destination, so alerts move off the default
"null"destination. - An application that calls the lab’s AI model, instrumented with OpenTelemetry’s generative AI conventions (tokens, model and latency).
- Production sampling. In the lab, the
Instrumentationsampled 100% (argument: "1"); lowering it to a production value is left for later.
End of the series
Over three parts, the lab went from “metrics on the workload cluster and alerts waiting for a destination” to logs, security findings, application traces and metrics, all linked together. Left for later: configuring a real Alertmanager destination, instrumenting an application that calls the lab’s AI model using OpenTelemetry’s generative AI conventions (tokens, model and latency), and lowering sampling to a production value.
Thanks for following along
If you are building observability on NKP and want to compare notes, reach out on LinkedIn.
References
Nutanix
- Nutanix Kubernetes Platform Guide 2.19 (Nutanix portal)
Projects and community
Comments
Comments use GitHub Discussions; you need a GitHub account.