Observability on NKPPart 2: NKP Insights
Tested onNKP 2.19NKP Insights 1.9.7CloudNativePG 0.29.0Lab date On a different version, check the compatibility matrix and the release notes before applying.
Summary: NKP Insights is the catalog app that analyzes the cluster and points out availability, configuration, best-practice and security points of attention, each with a cause and a solution. On the management cluster it came up in one minute, because the dependencies were already there. On the workload cluster it came up in about two minutes, with CloudNativePG enabled first and the Ceph storage from Part 1. In 10 minutes, it showed the Prometheus alerts with context and a lifecycle, inside Kommander, where the administrator already works. In 11 hours, it found 204 items, including security audits and the CIS Benchmark. This is part 2 of 3.
Where we left off
In Part 1, we turned on logs in the workload cluster and saw that Alertmanager, on since day one, comes with the default "null" destination, waiting for each environment’s real one, and that a critical rule, KubeProxyDown, does not apply to a cluster running Cilium.
| Part | Topic |
|---|---|
| 1 | The concepts and what NKP already ships |
| 2 | NKP Insights: the cluster pointing out its own points of attention (this post) |
| 3 | OpenTelemetry Operator: traces, metrics and logs from an application, without touching its code |
The question for this part: can an app from the platform itself turn those alerts into something someone reads and acts on?
What NKP Insights is
It is a Nutanix analytics tool that runs inside NKP. It continuously examines the cluster and produces insights: findings with severity, type, probable cause and suggested solution, shown in Kommander itself.
| Characteristic | In the NKP 2.19 catalog |
|---|---|
| Version | 1.9.7 |
| Category | Observability |
| Badges | NKP Core Platform and Nutanix Supported |
| Insight types | Availability, Best Practices, Configuration and Security |
| Severities | Critical, Warning and Notice |
| Default state | Off |
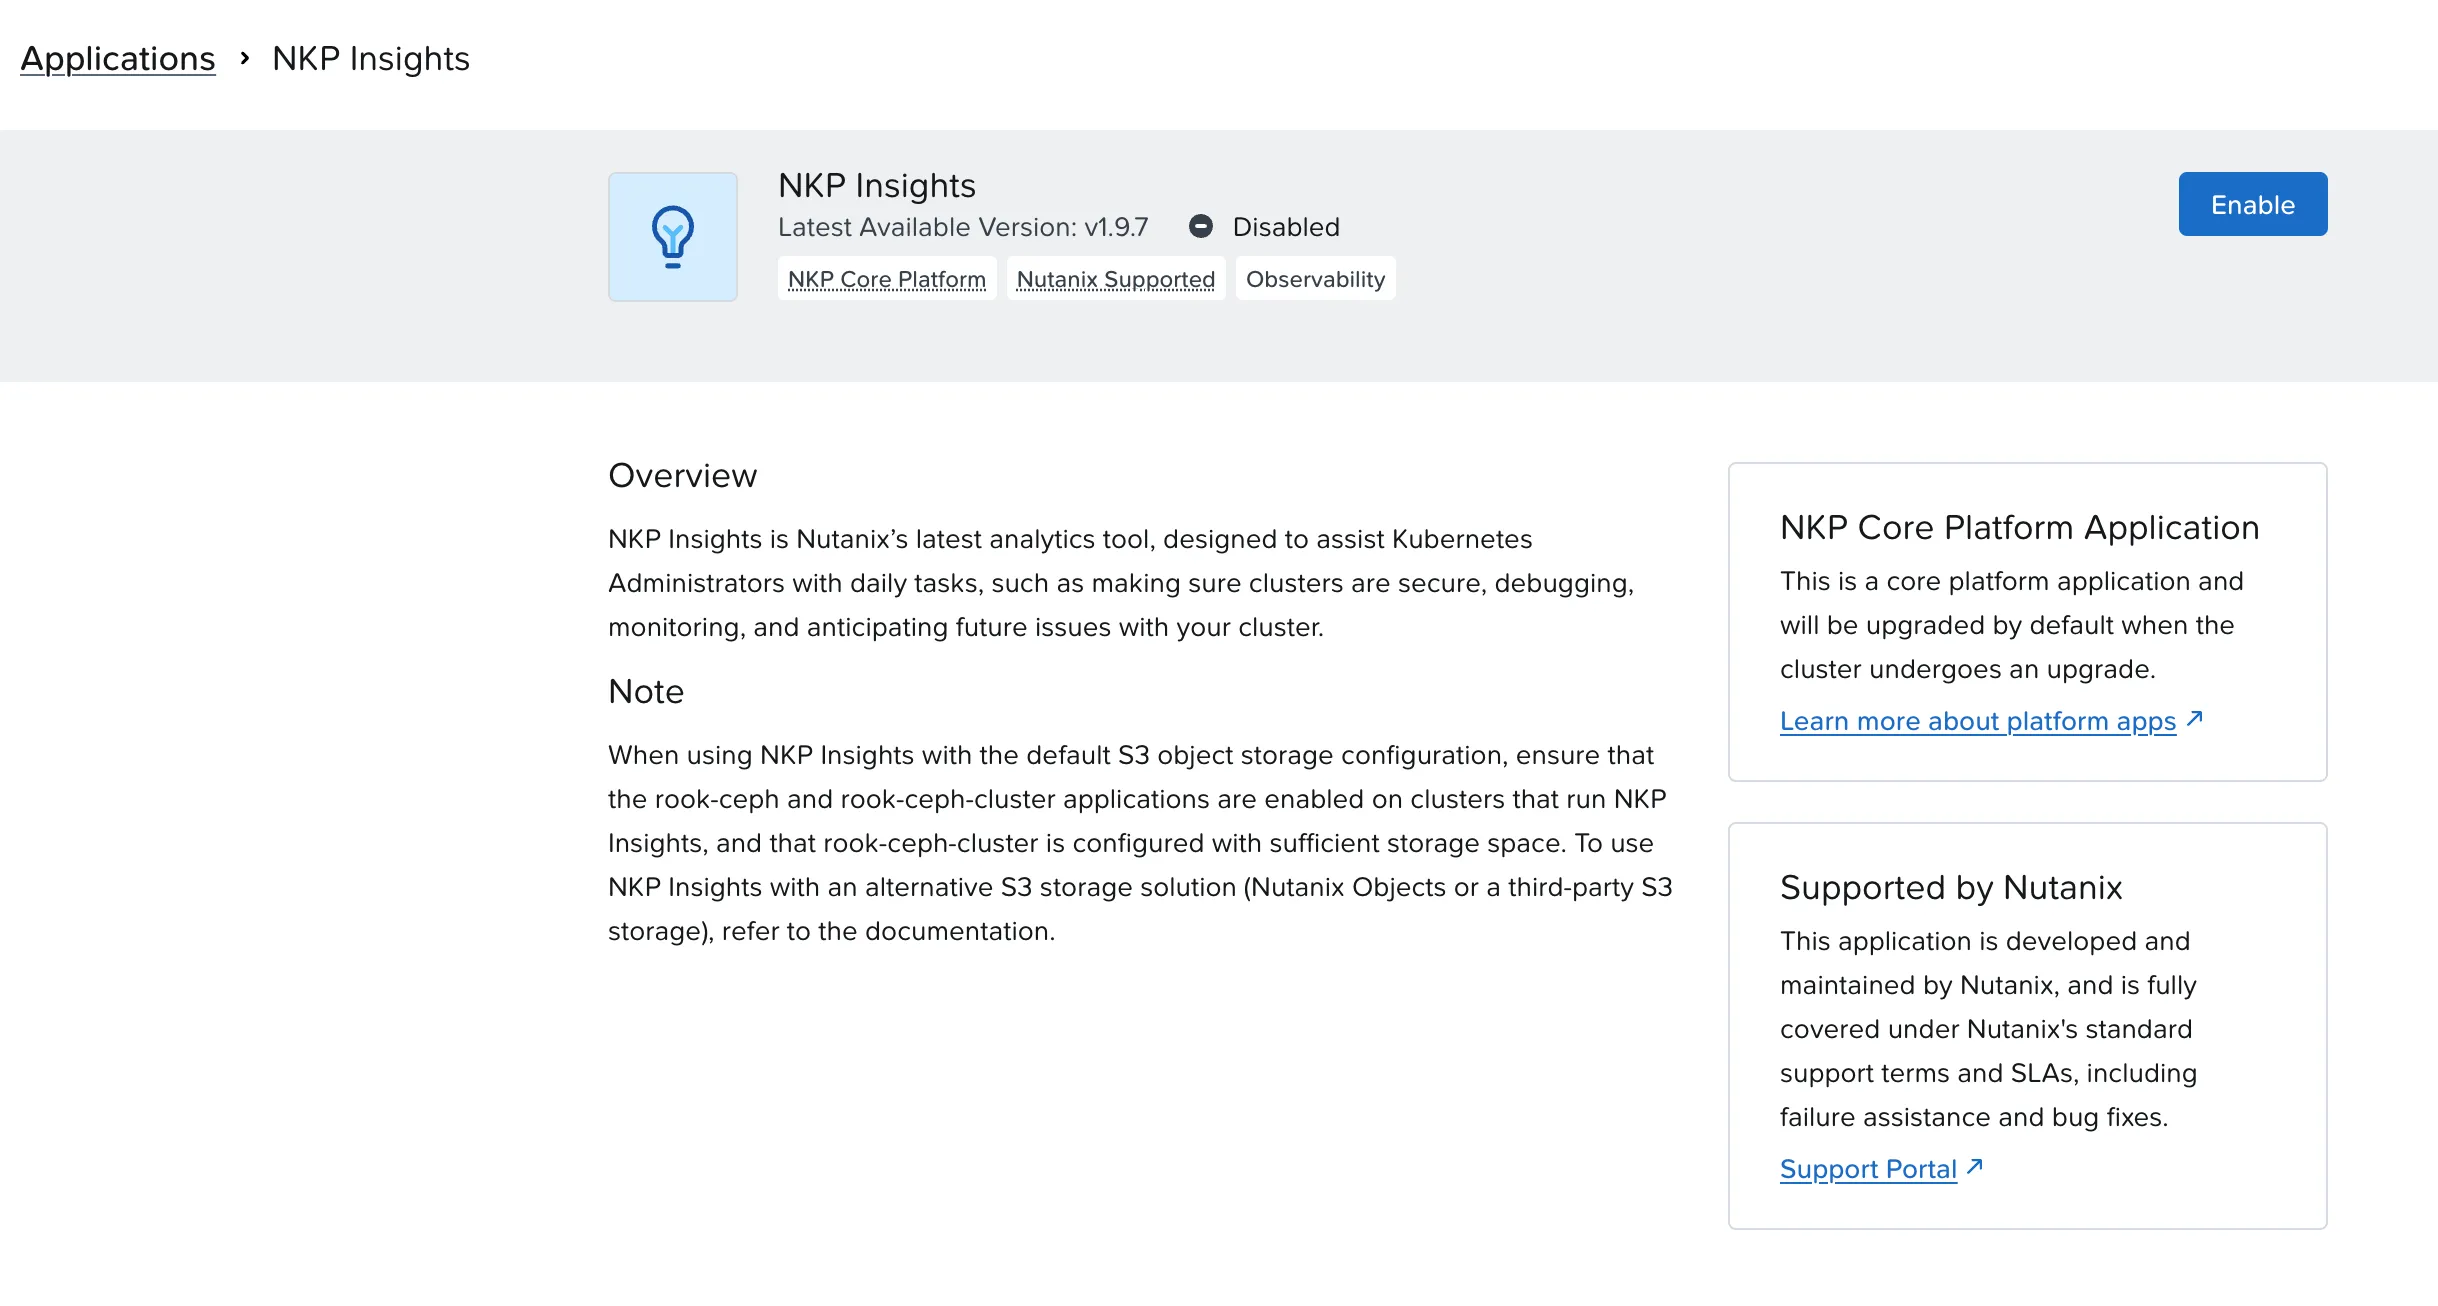
The note on the details page deserves attention: with the default configuration, Insights writes to an S3 bucket and expects the Rook Ceph and Rook Ceph Cluster apps enabled, with enough space. The alternative is to point it at Nutanix Objects or another S3 store.
How it is built
The Part 1 inventory already showed a detail worth knowing: the central part of Insights (nkp-insights-management) runs on the management cluster since installation, even with the app off. Enabling the app adds the analysis engine to each cluster.
%3b%7d%23mermaid-0 .cluster rect%7bfill:hsl(0%2c 0%25%2c 98.9215686275%25)%3bstroke:%23707070%3bstroke-width:1px%3b%7d%23mermaid-0 .cluster text%7bfill:%23333%3b%7d%23mermaid-0 .cluster span%7bcolor:%23333%3b%7d%23mermaid-0 .node .collapsed-indicator%7bfill:%23707070%3bstroke:none%3bopacity:0.6%3b%7d%23mermaid-0 .node .collapsed-separator%7bstroke:%23707070%3bstroke-width:0.75px%3b%7d%23mermaid-0 div.mermaidTooltip%7bposition:absolute%3btext-align:center%3bmax-width:200px%3bpadding:2px%3bfont-family:arial%2csans-serif%3bfont-size:12px%3bbackground:hsl(-160%2c 0%25%2c 93.3333333333%25)%3bborder:1px solid %23707070%3bborder-radius:2px%3bpointer-events:none%3bz-index:100%3b%7d%23mermaid-0 .flowchartTitleText%7btext-anchor:middle%3bfont-size:18px%3bfill:black%3b%7d%23mermaid-0 rect.text%7bfill:none%3bstroke-width:0%3b%7d%23mermaid-0 .icon-shape%2c%23mermaid-0 .image-shape%7bbackground-color:white%3btext-align:center%3b%7d%23mermaid-0 .icon-shape p%2c%23mermaid-0 .image-shape p%7bbackground-color:white%3bpadding:2px%3b%7d%23mermaid-0 .icon-shape .label rect%2c%23mermaid-0 .image-shape .label rect%7bopacity:0.5%3bbackground-color:white%3bfill:white%3b%7d%23mermaid-0 .label-icon%7bdisplay:inline-block%3bheight:1em%3boverflow:visible%3bvertical-align:-0.125em%3b%7d%23mermaid-0 .node .label-icon path%7bfill:currentColor%3bstroke:revert%3bstroke-width:revert%3b%7d%23mermaid-0 .node .neo-node%7bstroke:%23999%3b%7d%23mermaid-0 %5bdata-look='neo'%5d.node rect%2c%23mermaid-0 %5bdata-look='neo'%5d.cluster rect%2c%23mermaid-0 %5bdata-look='neo'%5d.node polygon%7bstroke:url(%23mermaid-0-gradient)%3bfilter:drop-shadow( 1px 2px 2px rgba(185%2c185%2c185%2c1))%3b%7d%23mermaid-0 %5bdata-look='neo'%5d.swimlane.cluster rect%7bfilter:none%3b%7d%23mermaid-0 %5bdata-look='neo'%5d.node path%7bstroke:url(%23mermaid-0-gradient)%3bstroke-width:1px%3b%7d%23mermaid-0 %5bdata-look='neo'%5d.node .outer-path%7bfilter:drop-shadow( 1px 2px 2px rgba(185%2c185%2c185%2c1))%3b%7d%23mermaid-0 %5bdata-look='neo'%5d.node .neo-line path%7bstroke:%23999%3bfilter:none%3b%7d%23mermaid-0 %5bdata-look='neo'%5d.node circle%7bstroke:url(%23mermaid-0-gradient)%3bfilter:drop-shadow( 1px 2px 2px rgba(185%2c185%2c185%2c1))%3b%7d%23mermaid-0 %5bdata-look='neo'%5d.node circle .state-start%7bfill:black%3b%7d%23mermaid-0 %5bdata-look='neo'%5d.icon-shape .icon%7bfill:url(%23mermaid-0-gradient)%3bfilter:drop-shadow( 1px 2px 2px rgba(185%2c185%2c185%2c1))%3b%7d%23mermaid-0 %5bdata-look='neo'%5d.icon-shape .icon-neo path%7bstroke:url(%23mermaid-0-gradient)%3bfilter:drop-shadow( 1px 2px 2px rgba(185%2c185%2c185%2c1))%3b%7d%23mermaid-0 :root%7b--mermaid-font-family:arial%2csans-serif%3b%7d%3c/style%3e%3cg%3e%3cmarker id='mermaid-0_flowchart-v2-pointEnd' class='marker flowchart-v2' viewBox='0 0 10 10' refX='5' refY='5' markerUnits='userSpaceOnUse' markerWidth='8' markerHeight='8' orient='auto'%3e%3cpath d='M 0 0 L 10 5 L 0 10 z' class='arrowMarkerPath' style='stroke-width: 1%3b stroke-dasharray: 1%2c 0%3b'/%3e%3c/marker%3e%3cmarker id='mermaid-0_flowchart-v2-pointStart' class='marker flowchart-v2' viewBox='0 0 10 10' refX='4.5' refY='5' markerUnits='userSpaceOnUse' markerWidth='8' markerHeight='8' orient='auto'%3e%3cpath d='M 0 5 L 10 10 L 10 0 z' class='arrowMarkerPath' style='stroke-width: 1%3b stroke-dasharray: 1%2c 0%3b'/%3e%3c/marker%3e%3cmarker id='mermaid-0_flowchart-v2-pointEnd-margin' class='marker flowchart-v2' viewBox='0 0 11.5 14' refX='11.5' refY='7' markerUnits='userSpaceOnUse' markerWidth='10.5' markerHeight='14' orient='auto'%3e%3cpath d='M 0 0 L 11.5 7 L 0 14 z' class='arrowMarkerPath' style='stroke-width: 0%3b stroke-dasharray: 1%2c 0%3b'/%3e%3c/marker%3e%3cmarker id='mermaid-0_flowchart-v2-pointStart-margin' class='marker flowchart-v2' viewBox='0 0 11.5 14' refX='1' refY='7' markerUnits='userSpaceOnUse' markerWidth='11.5' markerHeight='14' orient='auto'%3e%3cpolygon points='0%2c7 11.5%2c14 11.5%2c0' class='arrowMarkerPath' style='stroke-width: 0%3b stroke-dasharray: 1%2c 0%3b'/%3e%3c/marker%3e%3cmarker id='mermaid-0_flowchart-v2-circleEnd' class='marker flowchart-v2' viewBox='0 0 10 10' refX='11' refY='5' markerUnits='userSpaceOnUse' markerWidth='11' markerHeight='11' orient='auto'%3e%3ccircle cx='5' cy='5' r='5' class='arrowMarkerPath' style='stroke-width: 1%3b stroke-dasharray: 1%2c 0%3b'/%3e%3c/marker%3e%3cmarker id='mermaid-0_flowchart-v2-circleStart' class='marker flowchart-v2' viewBox='0 0 10 10' refX='-1' refY='5' markerUnits='userSpaceOnUse' markerWidth='11' markerHeight='11' orient='auto'%3e%3ccircle cx='5' cy='5' r='5' class='arrowMarkerPath' style='stroke-width: 1%3b stroke-dasharray: 1%2c 0%3b'/%3e%3c/marker%3e%3cmarker id='mermaid-0_flowchart-v2-circleEnd-margin' class='marker flowchart-v2' viewBox='0 0 10 10' refY='5' refX='12.25' markerUnits='userSpaceOnUse' markerWidth='14' markerHeight='14' orient='auto'%3e%3ccircle cx='5' cy='5' r='5' class='arrowMarkerPath' style='stroke-width: 0%3b stroke-dasharray: 1%2c 0%3b'/%3e%3c/marker%3e%3cmarker id='mermaid-0_flowchart-v2-circleStart-margin' class='marker flowchart-v2' viewBox='0 0 10 10' refX='-2' refY='5' markerUnits='userSpaceOnUse' markerWidth='14' markerHeight='14' orient='auto'%3e%3ccircle cx='5' cy='5' r='5' class='arrowMarkerPath' style='stroke-width: 0%3b stroke-dasharray: 1%2c 0%3b'/%3e%3c/marker%3e%3cmarker id='mermaid-0_flowchart-v2-crossEnd' class='marker cross flowchart-v2' viewBox='0 0 11 11' refX='12' refY='5.2' markerUnits='userSpaceOnUse' markerWidth='11' markerHeight='11' orient='auto'%3e%3cpath d='M 1%2c1 l 9%2c9 M 10%2c1 l -9%2c9' class='arrowMarkerPath' style='stroke-width: 2%3b stroke-dasharray: 1%2c 0%3b'/%3e%3c/marker%3e%3cmarker id='mermaid-0_flowchart-v2-crossStart' class='marker cross flowchart-v2' viewBox='0 0 11 11' refX='-1' refY='5.2' markerUnits='userSpaceOnUse' markerWidth='11' markerHeight='11' orient='auto'%3e%3cpath d='M 1%2c1 l 9%2c9 M 10%2c1 l -9%2c9' class='arrowMarkerPath' style='stroke-width: 2%3b stroke-dasharray: 1%2c 0%3b'/%3e%3c/marker%3e%3cmarker id='mermaid-0_flowchart-v2-crossEnd-margin' class='marker cross flowchart-v2' viewBox='0 0 15 15' refX='17.7' refY='7.5' markerUnits='userSpaceOnUse' markerWidth='12' markerHeight='12' orient='auto'%3e%3cpath d='M 1%2c1 L 14%2c14 M 1%2c14 L 14%2c1' class='arrowMarkerPath' style='stroke-width: 2.5%3b'/%3e%3c/marker%3e%3cmarker id='mermaid-0_flowchart-v2-crossStart-margin' class='marker cross flowchart-v2' viewBox='0 0 15 15' refX='-3.5' refY='7.5' markerUnits='userSpaceOnUse' markerWidth='12' markerHeight='12' orient='auto'%3e%3cpath d='M 1%2c1 L 14%2c14 M 1%2c14 L 14%2c1' class='arrowMarkerPath' style='stroke-width: 2.5%3b stroke-dasharray: 1%2c 0%3b'/%3e%3c/marker%3e%3cg class='root'%3e%3cg class='clusters'%3e%3cg class='cluster' id='mermaid-0-M' data-look='classic'%3e%3crect style='' x='1009.78125' y='8' width='623.171875' height='374'/%3e%3cg class='cluster-label' transform='translate(1248.8828125%2c 8)'%3e%3cforeignObject width='144.96875' height='24'%3e%3cdiv xmlns='http://www.w3.org/1999/xhtml' style='display: table-cell%3b white-space: nowrap%3b line-height: 1.5%3b'%3e%3cspan class='nodeLabel'%3e%3cp%3eManagement cluster%3c/p%3e%3c/span%3e%3c/div%3e%3c/foreignObject%3e%3c/g%3e%3c/g%3e%3c/g%3e%3cg class='edgePaths'%3e%3cpath d='M1467.953%2c170L1467.953%2c180C1467.953%2c190%2c1467.953%2c210%2c1467.953%2c223.5C1467.953%2c237%2c1467.953%2c244%2c1467.953%2c247.5L1467.953%2c251' id='mermaid-0-L_A1_D1_0' class='edge-thickness-normal edge-pattern-solid edge-thickness-normal edge-pattern-solid flowchart-link' style='%3b' data-edge='true' data-et='edge' data-id='L_A1_D1_0' data-points='W3sieCI6MTQ2Ny45NTMxMjUsInkiOjE3MH0seyJ4IjoxNDY3Ljk1MzEyNSwieSI6MjMwfSx7IngiOjE0NjcuOTUzMTI1LCJ5IjoyNTV9XQ==' data-look='classic' marker-end='url(%23mermaid-0_flowchart-v2-pointEnd)'/%3e%3cpath d='M928.007%2c146L967.733%2c160C1007.46%2c174%2c1086.914%2c202%2c1126.64%2c221.5C1166.367%2c241%2c1166.367%2c252%2c1166.367%2c257.5L1166.367%2c263' id='mermaid-0-L_K_C_0' class='edge-thickness-normal edge-pattern-solid edge-thickness-normal edge-pattern-solid flowchart-link' style='%3b' data-edge='true' data-et='edge' data-id='L_K_C_0' data-points='W3sieCI6OTI4LjAwNjU0NTYwODEwODEsInkiOjE0Nn0seyJ4IjoxMTY2LjM2NzE4NzUsInkiOjIzMH0seyJ4IjoxMTY2LjM2NzE4NzUsInkiOjI2N31d' data-look='classic' marker-end='url(%23mermaid-0_flowchart-v2-pointEnd)'/%3e%3c/g%3e%3cg class='edgeLabels'%3e%3cg class='edgeLabel'%3e%3cg class='label' data-id='L_A1_D1_0' transform='translate(0%2c 0)'%3e%3cforeignObject width='0' height='0'%3e%3cdiv xmlns='http://www.w3.org/1999/xhtml' class='labelBkg' style='display: table-cell%3b white-space: nowrap%3b line-height: 1.5%3b max-width: 200px%3b text-align: center%3b'%3e%3cspan class='edgeLabel'%3e%3c/span%3e%3c/div%3e%3c/foreignObject%3e%3c/g%3e%3c/g%3e%3cg class='edgeLabel'%3e%3cg class='label' data-id='L_K_C_0' transform='translate(0%2c 0)'%3e%3cforeignObject width='0' height='0'%3e%3cdiv xmlns='http://www.w3.org/1999/xhtml' class='labelBkg' style='display: table-cell%3b white-space: nowrap%3b line-height: 1.5%3b max-width: 200px%3b text-align: center%3b'%3e%3cspan class='edgeLabel'%3e%3c/span%3e%3c/div%3e%3c/foreignObject%3e%3c/g%3e%3c/g%3e%3c/g%3e%3cg class='nodes'%3e%3cg class='root' transform='translate(0%2c 25)'%3e%3cg class='clusters'%3e%3cg class='cluster' id='mermaid-0-W' data-look='classic'%3e%3crect style='' x='8' y='8' width='670' height='172'/%3e%3cg class='cluster-label' transform='translate(283.5703125%2c 8)'%3e%3cforeignObject width='118.859375' height='24'%3e%3cdiv xmlns='http://www.w3.org/1999/xhtml' style='display: table-cell%3b white-space: nowrap%3b line-height: 1.5%3b'%3e%3cspan class='nodeLabel'%3e%3cp%3eWorkload cluster%3c/p%3e%3c/span%3e%3c/div%3e%3c/foreignObject%3e%3c/g%3e%3c/g%3e%3c/g%3e%3cg class='edgePaths'%3e%3cpath d='M305.5%2c94L311.75%2c94C318%2c94%2c330.5%2c94%2c342.333%2c94C354.167%2c94%2c365.333%2c94%2c370.917%2c94L376.5%2c94' id='mermaid-0-L_A2_D2_0' class='edge-thickness-normal edge-pattern-solid edge-thickness-normal edge-pattern-solid flowchart-link' style='%3b' data-edge='true' data-et='edge' data-id='L_A2_D2_0' data-points='W3sieCI6MzA1LjUsInkiOjk0fSx7IngiOjM0MywieSI6OTR9LHsieCI6MzgwLjUsInkiOjk0fV0=' data-look='classic' marker-end='url(%23mermaid-0_flowchart-v2-pointEnd)'/%3e%3c/g%3e%3cg class='edgeLabels'%3e%3cg class='edgeLabel'%3e%3cg class='label' data-id='L_A2_D2_0' transform='translate(0%2c 0)'%3e%3cforeignObject width='0' height='0'%3e%3cdiv xmlns='http://www.w3.org/1999/xhtml' class='labelBkg' style='display: table-cell%3b white-space: nowrap%3b line-height: 1.5%3b max-width: 200px%3b text-align: center%3b'%3e%3cspan class='edgeLabel'%3e%3c/span%3e%3c/div%3e%3c/foreignObject%3e%3c/g%3e%3c/g%3e%3c/g%3e%3cg class='nodes'%3e%3cg class='node default' id='mermaid-0-flowchart-A2-3' data-look='classic' transform='translate(175.5%2c 94)'%3e%3crect class='basic label-container' style='' x='-130' y='-51' width='260' height='102'/%3e%3cg class='label' style='' transform='translate(-100%2c -36)'%3e%3crect/%3e%3cforeignObject width='200' height='72'%3e%3cdiv xmlns='http://www.w3.org/1999/xhtml' style='display: table%3b white-space: break-spaces%3b line-height: 1.5%3b max-width: 200px%3b text-align: center%3b width: 200px%3b'%3e%3cspan class='nodeLabel'%3e%3cp%3eAnalysis engine%3cbr /%3ebackend%2c forwarder%2c resolution-cm%3c/p%3e%3c/span%3e%3c/div%3e%3c/foreignObject%3e%3c/g%3e%3c/g%3e%3cg class='node default' id='mermaid-0-flowchart-D2-4' data-look='classic' transform='translate(510.5%2c 94)'%3e%3crect class='basic label-container' style='' x='-130' y='-51' width='260' height='102'/%3e%3cg class='label' style='' transform='translate(-100%2c -36)'%3e%3crect/%3e%3cforeignObject width='200' height='72'%3e%3cdiv xmlns='http://www.w3.org/1999/xhtml' style='display: table%3b white-space: break-spaces%3b line-height: 1.5%3b max-width: 200px%3b text-align: center%3b width: 200px%3b'%3e%3cspan class='nodeLabel'%3e%3cp%3ePostgreSQL (CloudNativePG)%3cbr /%3eand Ceph bucket%3c/p%3e%3c/span%3e%3c/div%3e%3c/foreignObject%3e%3c/g%3e%3c/g%3e%3c/g%3e%3c/g%3e%3cg class='node default' id='mermaid-0-flowchart-C-0' data-look='classic' transform='translate(1166.3671875%2c 306)'%3e%3crect class='basic label-container' style='' x='-121.5859375' y='-39' width='243.171875' height='78'/%3e%3cg class='label' style='' transform='translate(-91.5859375%2c -24)'%3e%3crect/%3e%3cforeignObject width='183.171875' height='48'%3e%3cdiv xmlns='http://www.w3.org/1999/xhtml' style='display: table-cell%3b white-space: nowrap%3b line-height: 1.5%3b max-width: 200px%3b text-align: center%3b'%3e%3cspan class='nodeLabel'%3e%3cp%3eCentral part%3cbr /%3eauth-server and mgmt-cm%3c/p%3e%3c/span%3e%3c/div%3e%3c/foreignObject%3e%3c/g%3e%3c/g%3e%3cg class='node default' id='mermaid-0-flowchart-A1-1' data-look='classic' transform='translate(1467.953125%2c 119)'%3e%3crect class='basic label-container' style='' x='-130' y='-51' width='260' height='102'/%3e%3cg class='label' style='' transform='translate(-100%2c -36)'%3e%3crect/%3e%3cforeignObject width='200' height='72'%3e%3cdiv xmlns='http://www.w3.org/1999/xhtml' style='display: table%3b white-space: break-spaces%3b line-height: 1.5%3b max-width: 200px%3b text-align: center%3b width: 200px%3b'%3e%3cspan class='nodeLabel'%3e%3cp%3eAnalysis engine%3cbr /%3ebackend%2c forwarder%2c resolution-cm%3c/p%3e%3c/span%3e%3c/div%3e%3c/foreignObject%3e%3c/g%3e%3c/g%3e%3cg class='node default' id='mermaid-0-flowchart-D1-2' data-look='classic' transform='translate(1467.953125%2c 306)'%3e%3crect class='basic label-container' style='' x='-130' y='-51' width='260' height='102'/%3e%3cg class='label' style='' transform='translate(-100%2c -36)'%3e%3crect/%3e%3cforeignObject width='200' height='72'%3e%3cdiv xmlns='http://www.w3.org/1999/xhtml' style='display: table%3b white-space: break-spaces%3b line-height: 1.5%3b max-width: 200px%3b text-align: center%3b width: 200px%3b'%3e%3cspan class='nodeLabel'%3e%3cp%3ePostgreSQL (CloudNativePG)%3cbr /%3eand Ceph bucket%3c/p%3e%3c/span%3e%3c/div%3e%3c/foreignObject%3e%3c/g%3e%3c/g%3e%3cg class='node default' id='mermaid-0-flowchart-K-9' data-look='classic' transform='translate(851.390625%2c 119)'%3e%3crect class='basic label-container' style='' x='-123.390625' y='-27' width='246.78125' height='54'/%3e%3cg class='label' style='' transform='translate(-93.390625%2c -12)'%3e%3crect/%3e%3cforeignObject width='186.78125' height='24'%3e%3cdiv xmlns='http://www.w3.org/1999/xhtml' style='display: table-cell%3b white-space: nowrap%3b line-height: 1.5%3b max-width: 200px%3b text-align: center%3b'%3e%3cspan class='nodeLabel'%3e%3cp%3eKommander Insights page%3c/p%3e%3c/span%3e%3c/div%3e%3c/foreignObject%3e%3c/g%3e%3c/g%3e%3c/g%3e%3c/g%3e%3c/g%3e%3cdefs%3e%3cfilter id='mermaid-0-drop-shadow' height='130%25' width='130%25'%3e%3cfeDropShadow dx='4' dy='4' stdDeviation='0' flood-opacity='0.06' flood-color='black'/%3e%3c/filter%3e%3c/defs%3e%3cdefs%3e%3cfilter id='mermaid-0-drop-shadow-small' height='150%25' width='150%25'%3e%3cfeDropShadow dx='2' dy='2' stdDeviation='0' flood-opacity='0.06' flood-color='black'/%3e%3c/filter%3e%3c/defs%3e%3clinearGradient id='mermaid-0-gradient' gradientUnits='objectBoundingBox' x1='0%25' y1='0%25' x2='100%25' y2='0%25'%3e%3cstop offset='0%25' stop-color='hsl(0%2c 0%25%2c 83.3333333333%25)' stop-opacity='1'/%3e%3cstop offset='100%25' stop-color='hsl(0%2c 0%25%2c 88.9215686275%25)' stop-opacity='1'/%3e%3c/linearGradient%3e%3c/svg%3e)
| Component | Role |
|---|---|
backend | Analyzes the cluster and produces the findings |
forwarder | Forwards the findings |
resolution-cm | Manages each finding’s lifecycle: open, muted, resolved |
postgresql | Its own database, created by CloudNativePG |
object-store-init | Job that prepares the Ceph bucket and exits |
auth-server and mgmt-cm | Central part, management cluster only |
An old warning with a familiar name
In the upgrade series, Headlamp showed a warning repeated more than a hundred times. The object was the FederatedSecret nkp-insights-federated-sa-token, which exists in every workspace, with Insights on or off. In other words, it belongs to the central part that comes installed out of the box.
Enabling it on management: one minute
Goal: have Insights analyzing the management cluster.
In the management workspace, the Enable screen lists two dependencies, Prometheus Monitoring and CloudNativePG, and does not ask you to pick a cluster, because there is only one. Both dependencies were already there, as was Ceph with HEALTH_OK.
$ kubectl -n kommander get pods | grep insightsnkp-insights-backend-deployment-... 1/1 Running 3m59snkp-insights-backend-forwarder-... 1/1 Running 4m14snkp-insights-management-auth-server-... 1/1 Running 30hnkp-insights-management-mgmt-cm-... 1/1 Running 30hnkp-insights-object-store-init-... 0/1 Completed 4m14snkp-insights-postgresql-1 1/1 Running 4m36snkp-insights-resolution-cm-... 1/1 Running 4m14sNote the ages: the central part was 30 hours old; the rest, 4 minutes. The only warning event was a forwarder health check in the first second, normal during startup.
Enabling it on the workload cluster: dependencies first
Goal: the same, on the workload cluster, applying the best practice from Part 1: dependencies before the app.
Here CloudNativePG did not exist. I enabled it first (it sits in the General category of the catalog) and only then Insights. In the workload workspace, the Enable screen asks you to pick the cluster:
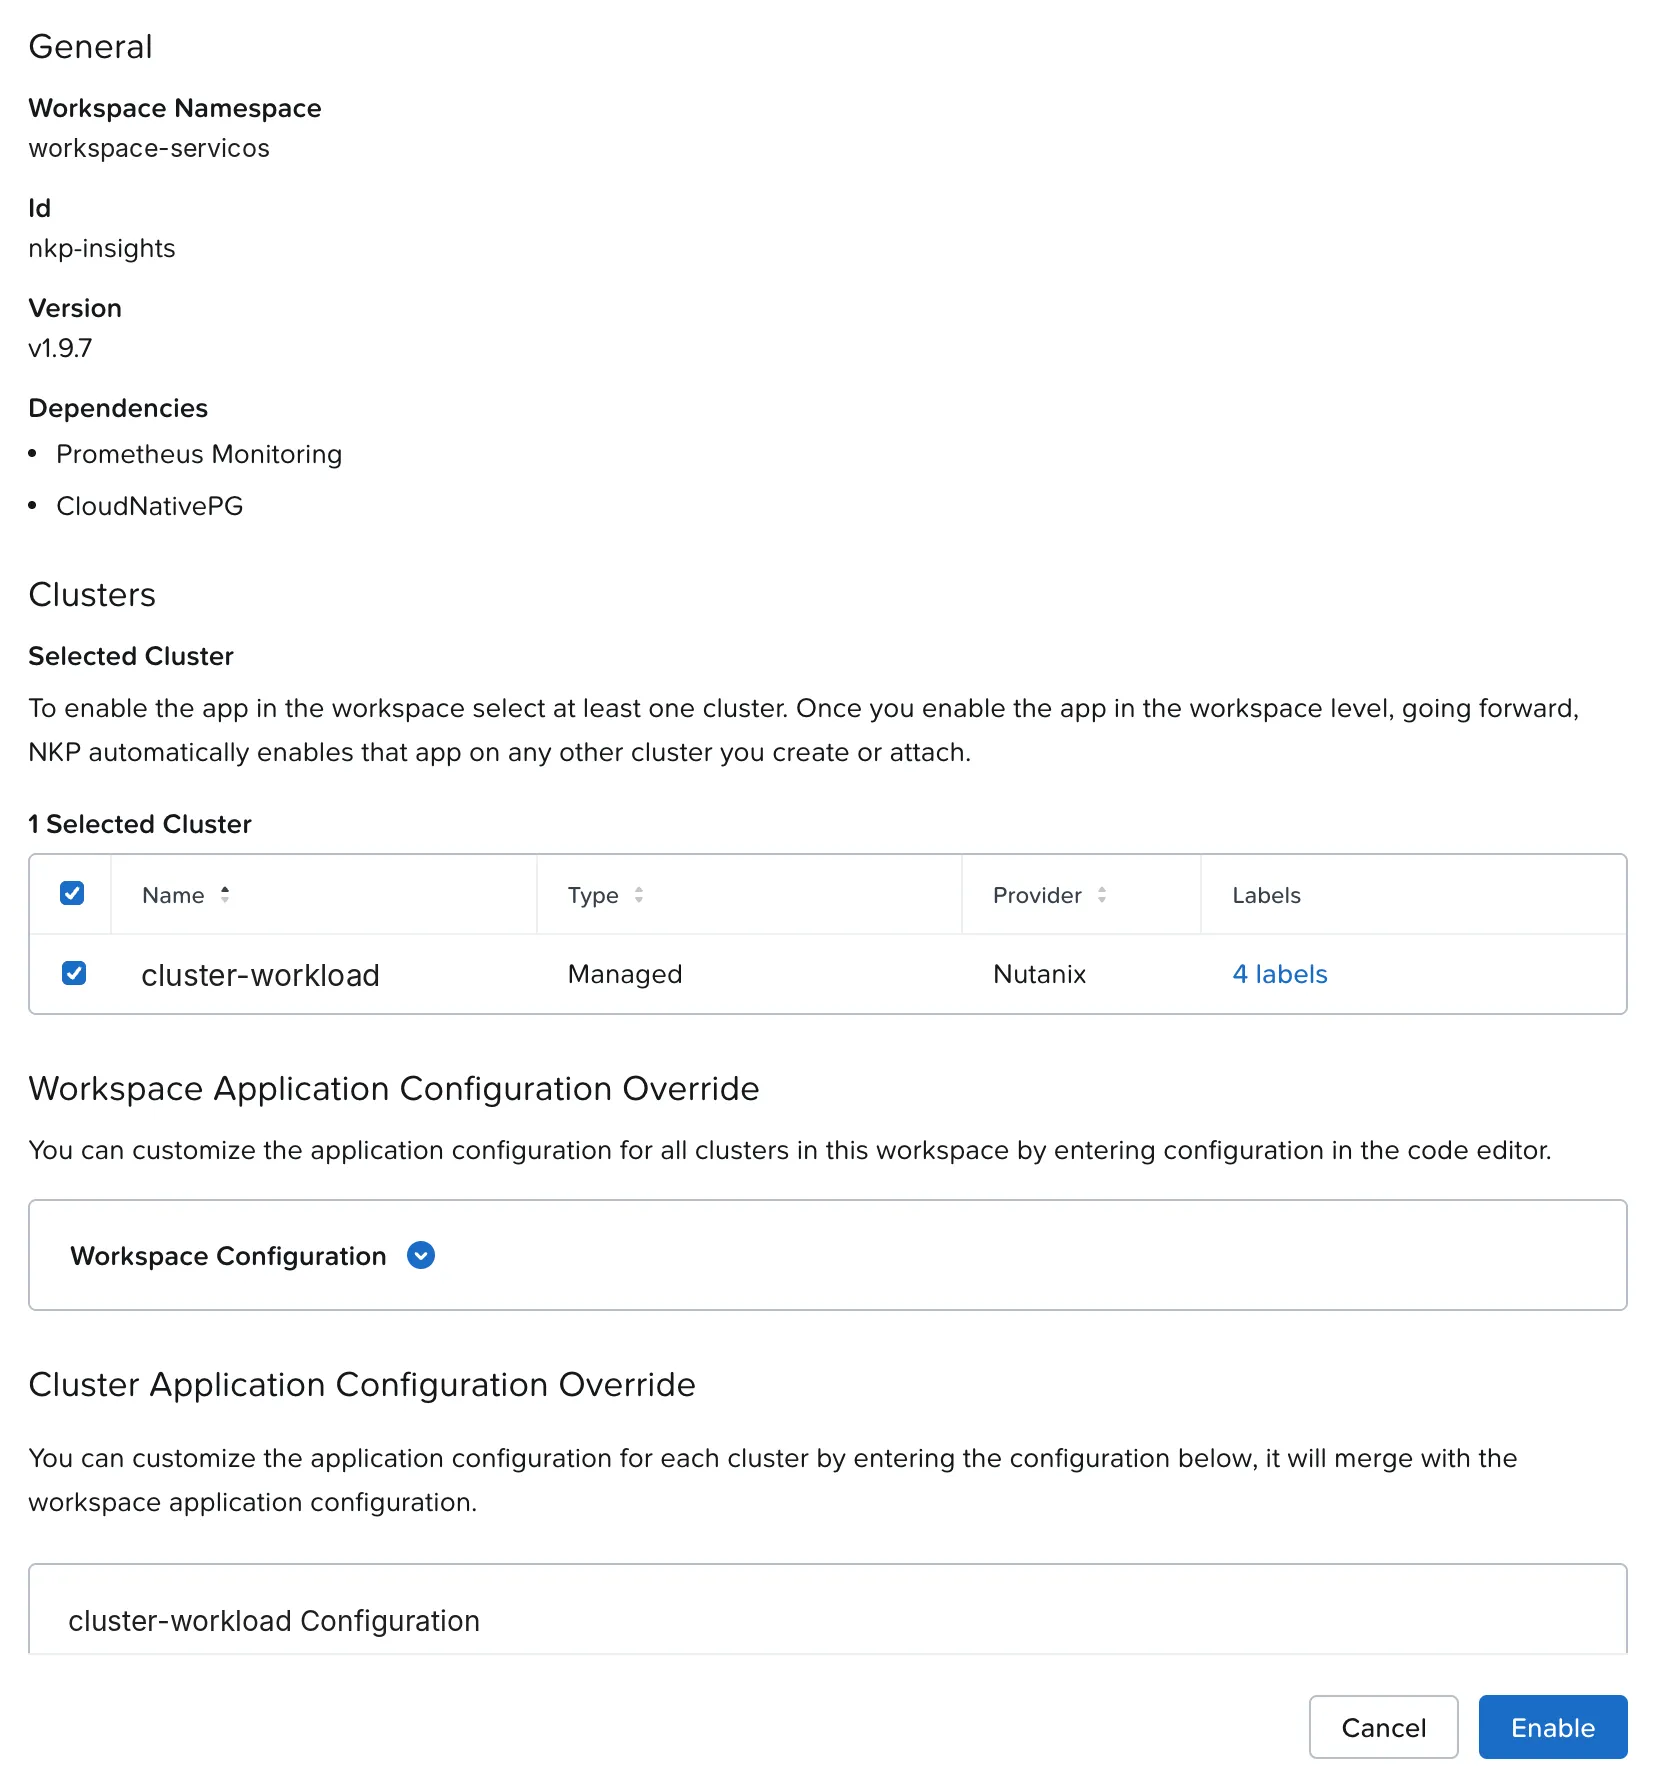
In about two minutes, the CloudNativePG operator, the Insights database and the analysis engine were up:
$ kubectl get clusters.postgresql.cnpg.io -ANAME INSTANCES READY STATUSnkp-insights-postgresql 1 1 Cluster in healthy stateobject-store-init used the Ceph cluster we created in Part 1 for logs. Without it, Insights would wait for the bucket, like Loki in Part 1.
Order that worked on the workload cluster
- Rook Ceph and Rook Ceph Cluster (already done in Part 1)
- CloudNativePG
- NKP Insights
What it found in the first 10 minutes
On management, four findings. On workload, three.
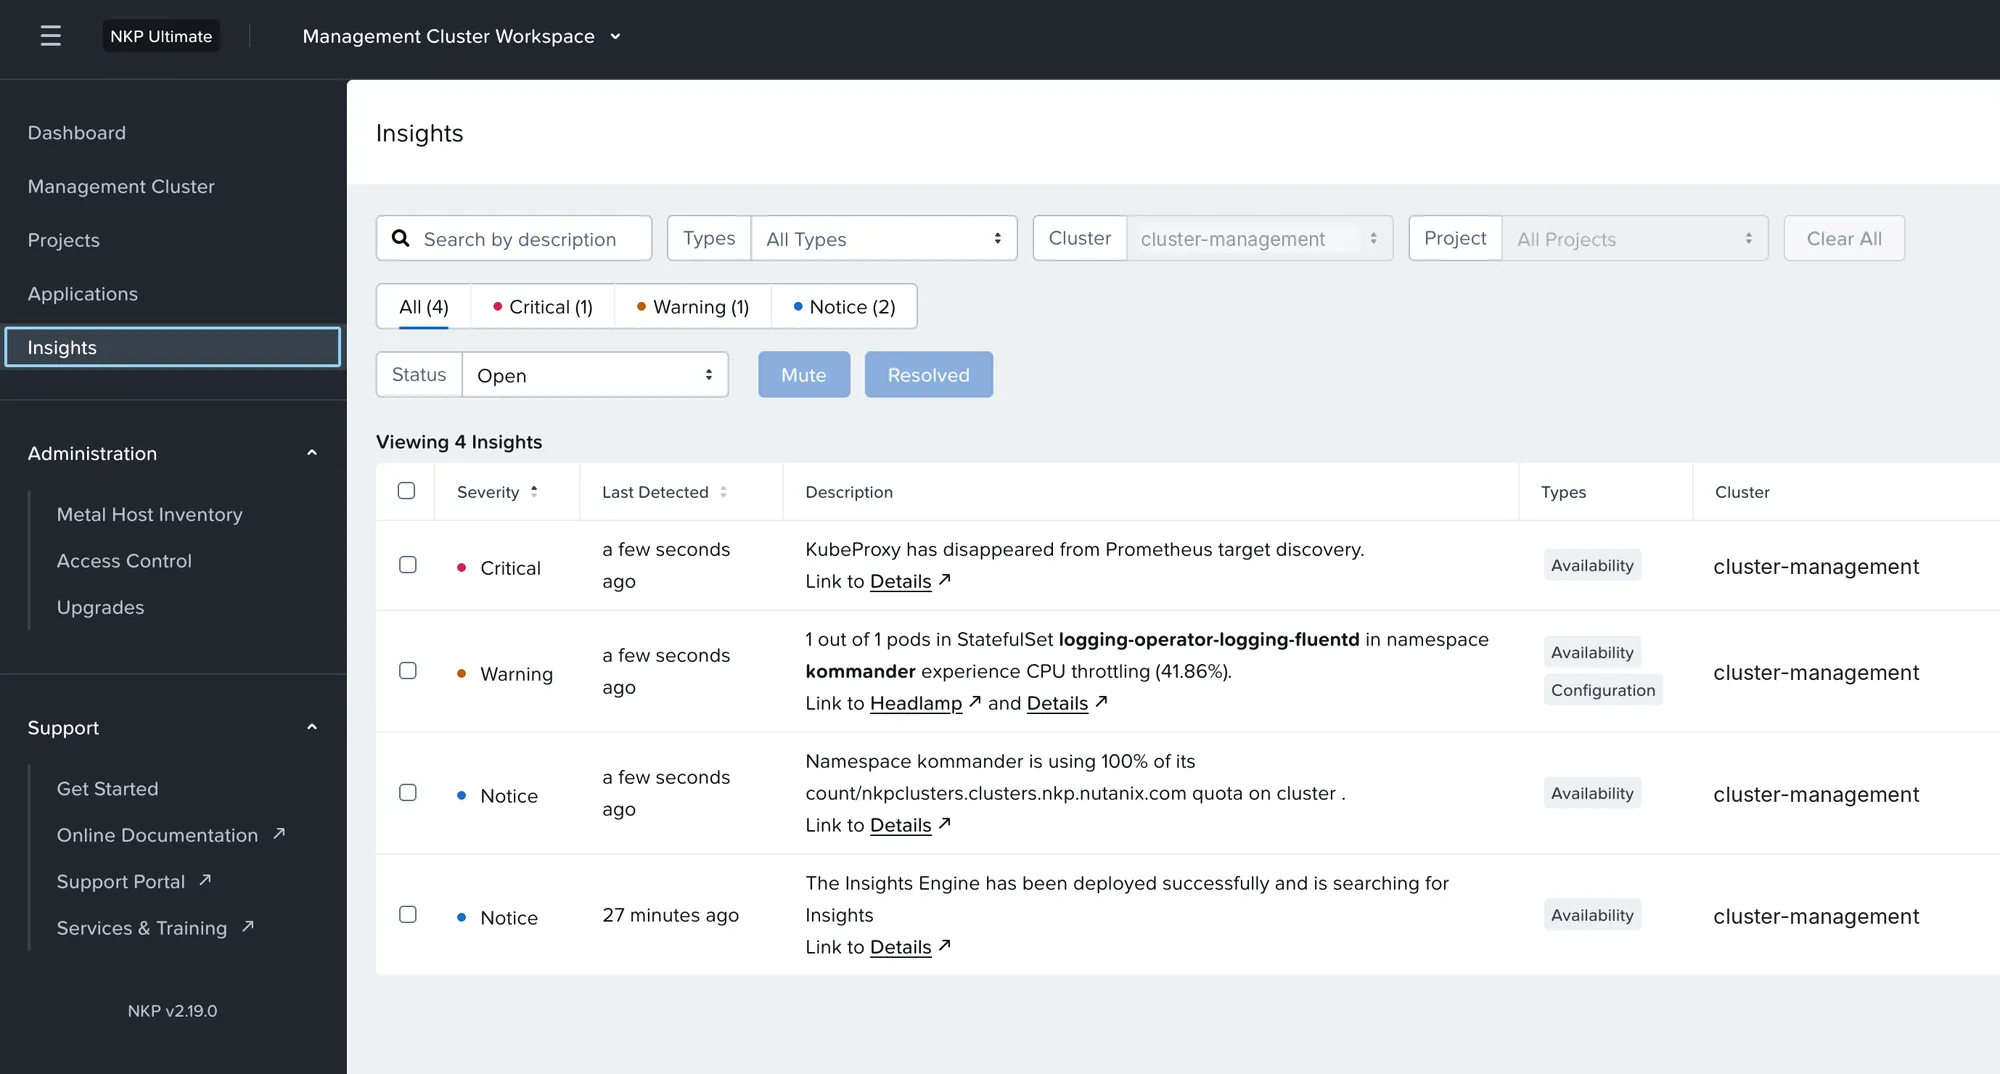
| Finding | Management | Workload | Type |
|---|---|---|---|
| KubeProxy disappeared from Prometheus | Critical | Critical | Availability |
| CPU throttling on the Fluentd sidecar | Warning (41.9%) | Notice (28.6%) | Availability and Configuration |
kommander namespace at 100% of its nkpclusters quota | Notice | — | Availability |
| Insights engine deployed | Notice | Notice | Availability |
Two things stand out. First, these are the same points Alertmanager showed in Part 1, but without the helper alerts Watchdog and InfoInhibitor, and inside Kommander, where the administrator already works. Second, the same cause got different severities: throttling is Warning on management and Notice on workload, because the limit was exceeded more on one than the other.
A finding from the inside
What sets Insights apart from a list of alerts is the detail page. Here is the one for the Fluentd throttling:
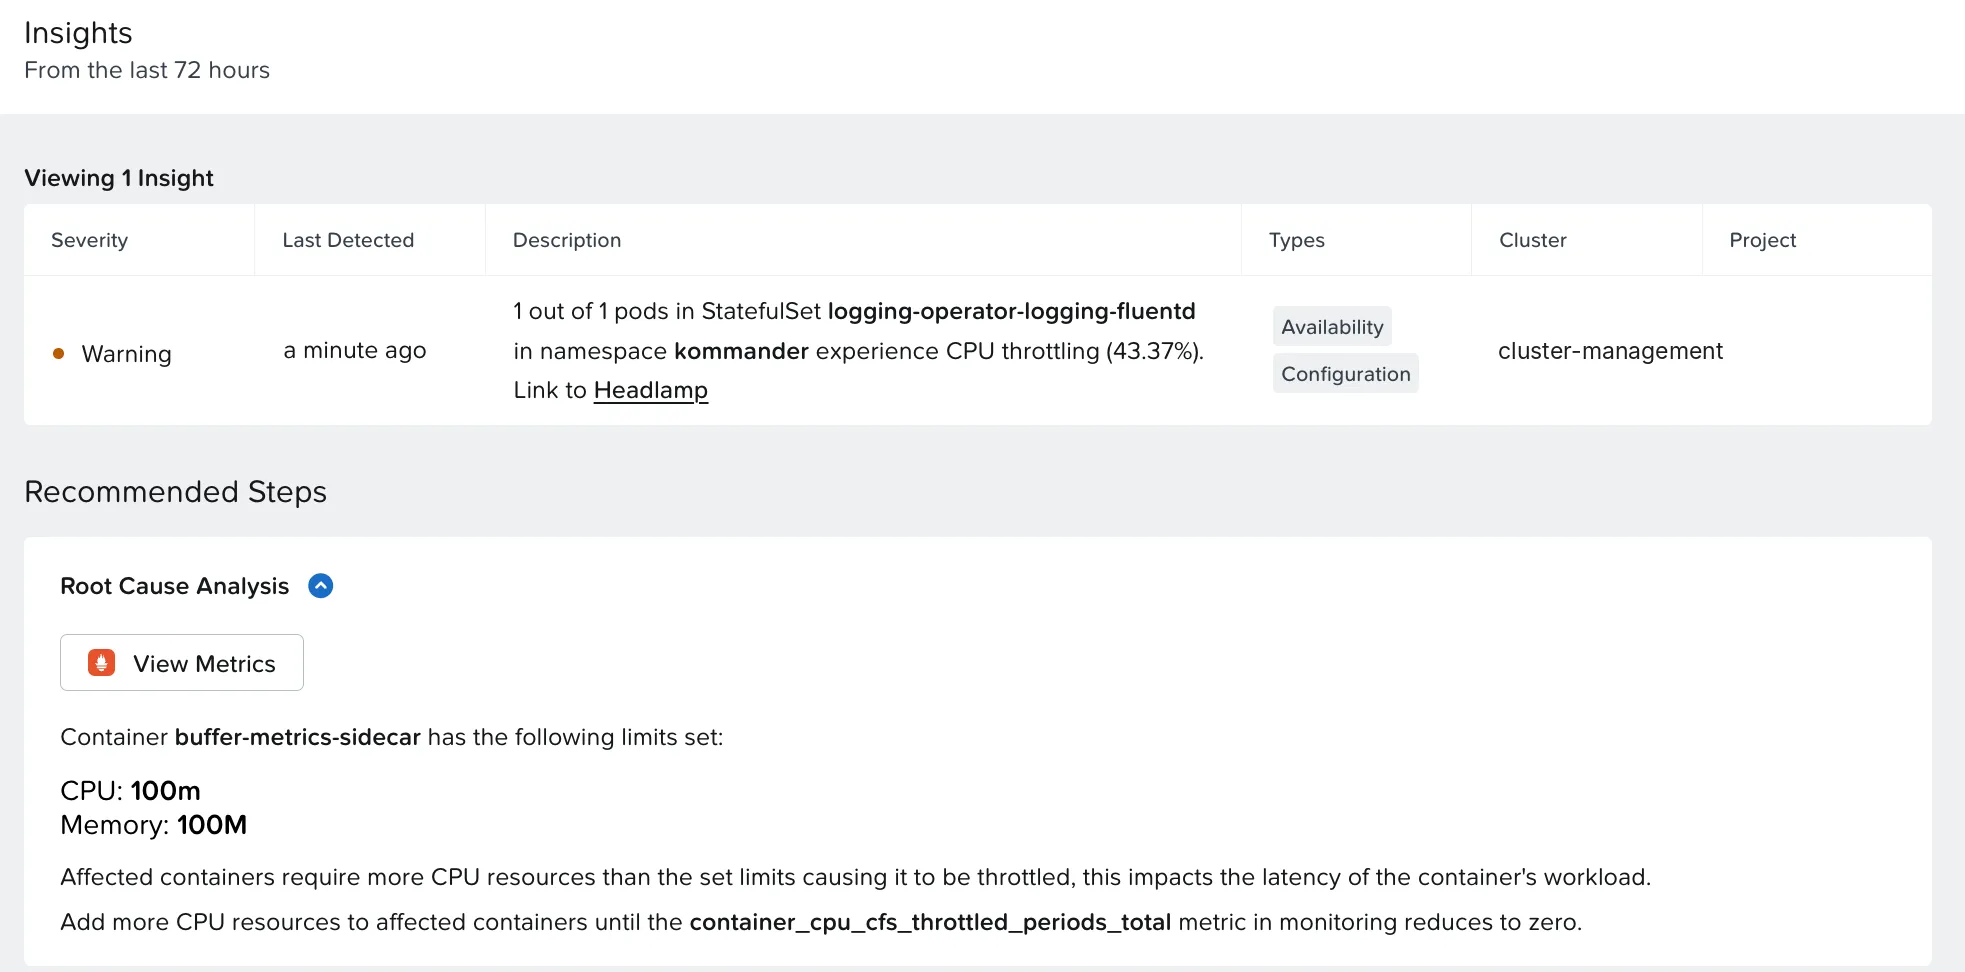
| Section | What it shows |
|---|---|
| Root Cause Analysis | The limits of the buffer-metrics-sidecar container (100m CPU, 100M memory), a View Metrics button and the metric to watch: container_cpu_cfs_throttled_periods_total |
| Solutions | The affected NKP component (Logging Operator) and where to adjust: resources and the app’s Helm values |
| Guidance | When to mark it Resolved (you fixed it) and when to mark it Muted (you know it has no impact) |
| Links | Kubernetes docs on requests and limits and kernel docs on CFS |
The finding’s Headlamp link opens the Fluentd StatefulSet directly. From warning to object in one click.
The lifecycle: Open, Muted and Resolved
The nkpclusters quota finding is intentional: NKP limits each workspace to one cluster. It is the textbook case for Mute.
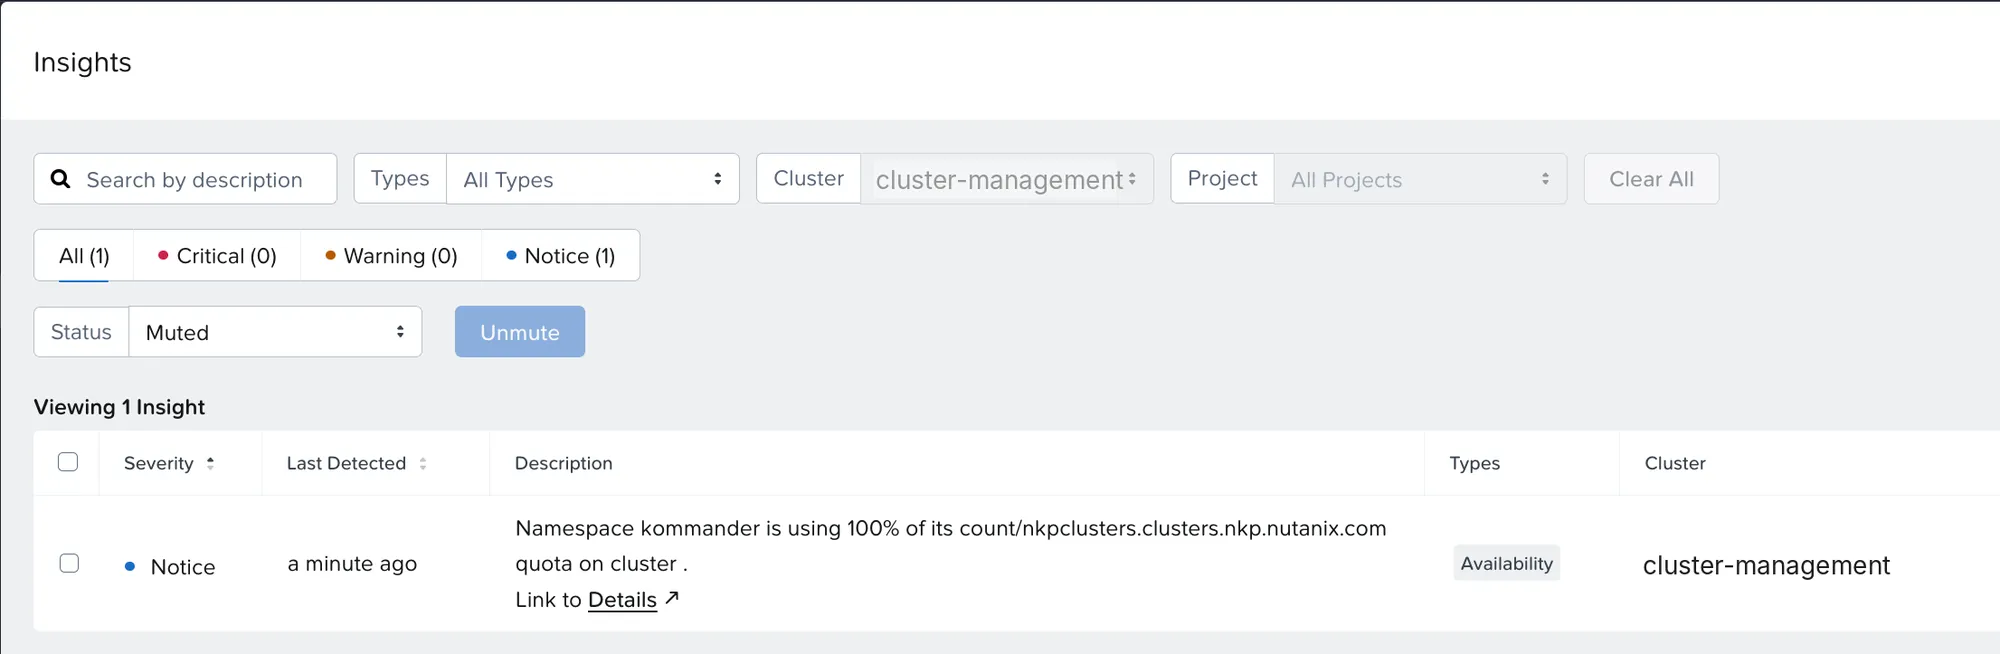
Once muted, it leaves the open list but stays tracked and can come back with Unmute. A finding marked Resolved only reappears if the condition returns. That is a kind of control Alertmanager alone does not offer: there, either the alert is firing or someone created a time-boxed silence.
After 11 hours: 204 findings
The next day, the workload cluster had 204 open findings: 9 Critical, 50 Warning and 145 Notice.
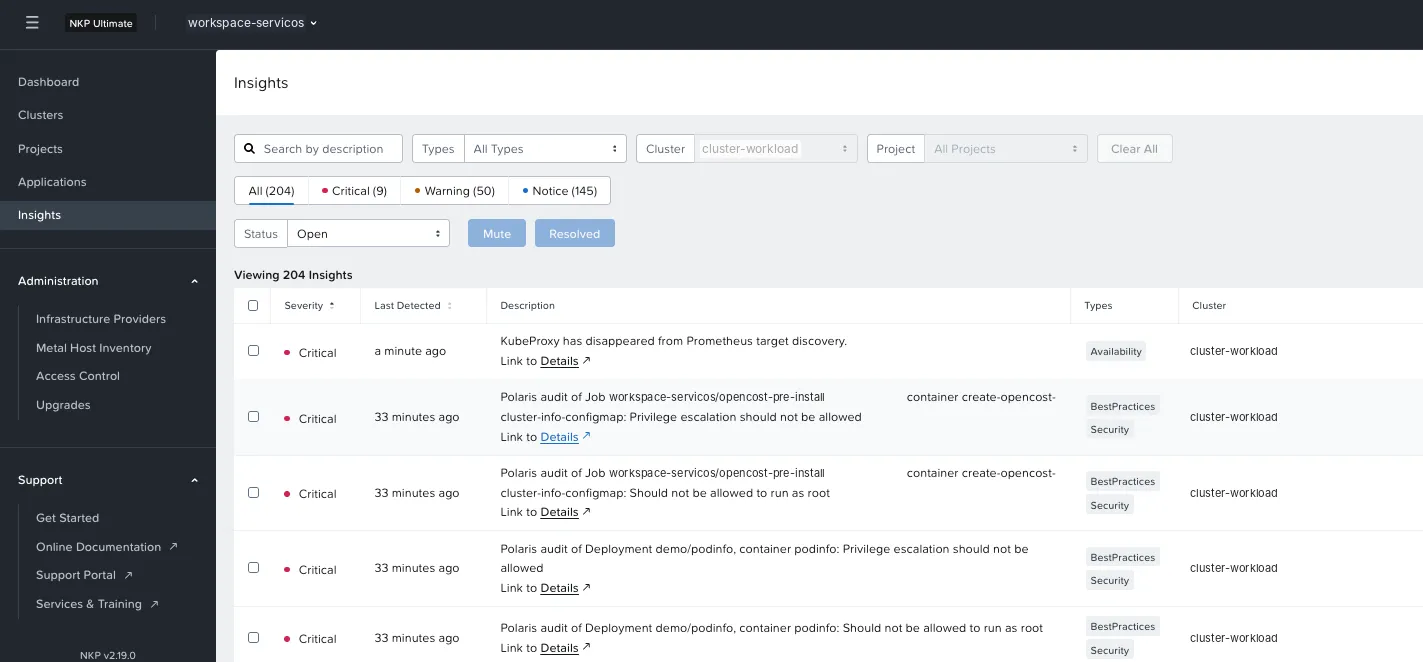
| Source | How many | Examples |
|---|---|---|
| Polaris audit (Best Practices and Security) | 35 | Containers running as root or with privilege escalation; no CPU and memory limits; no liveness probe; single replica; Ingress without TLS |
| Kubernetes CIS Benchmark (Security) | 165 | 144 passed, 8 failed, 13 that need manual checking |
| Availability and configuration | 4 | KubeProxyDown, Fluentd throttling, engine deployed and a crashlooping ReplicaSet |
The last item deserves attention. During the Part 3 lab, the OpenTelemetry Collector went into a crashloop because of a setting missing from the configuration I wrote. Insights recorded the finding about two minutes later, before I investigated.
Best practice: filter by severity and type
Of the 204 findings, 145 are Notice, most of them CIS tests that passed. Start by filtering on Critical and Warning and on the Security type; leave the Notice items for a periodic review. It is the same lesson as the alerts in Part 1: prioritize what calls for action.
How much it uses
Measured with kubectl top, right after startup:
| Cluster | CPU | Memory | Disk |
|---|---|---|---|
| Workload (engine + database) | ~18 millicores | ~460 MiB | 8 GiB volume for PostgreSQL |
| Management (engine + database + central part) | ~27 millicores | ~830 MiB | — |
backend is the biggest memory consumer. For sizing, add the dependencies: CloudNativePG and, if it does not exist yet, the Ceph cluster from Part 1.
Insights × Alertmanager × Headlamp
| Alertmanager | NKP Insights | Headlamp | |
|---|---|---|---|
| What it is | Prometheus alert router | Continuous analysis with cause and solution | Kubernetes web UI |
| Source of findings | Prometheus rules | Its own rules, Polaris, CIS and metrics | Object events and state |
| Context | Labels and a runbook link | Cause, solution, affected component | The object and its events |
| Lifecycle | Time-boxed silence | Open, Muted and Resolved | — |
| External notification | Yes, if configured | Not seen in the lab | No |
| Best for | Waking someone up at 3 a.m. | Daily review and cluster hygiene | Investigating an object |
They complement each other: Insights organizes the daily review for whoever opens Kommander, and Alertmanager, with a real destination configured, is what notifies people outside it. In the lab, I did not find an external notification option in Insights.
Privacy, access and licensing
- Where the data lives: in the cluster itself, in PostgreSQL and the Ceph bucket. I did not analyze outbound traffic; for regulated environments, confirm with Nutanix.
- Who sees it: the Insights page lives inside each Kommander workspace and filters by cluster and project, so it follows the NKP workspace model and permissions.
- Licensing: the lab runs NKP Ultimate. Confirm with Nutanix which edition includes Insights before putting it in a proposal.
What I learned
- The central part of Insights comes installed, even with the app off. Enabling it adds the analysis engine to each cluster.
- On the workload cluster, dependencies come first: Ceph, CloudNativePG and only then Insights.
- Within minutes, Insights shows the alerts inside Kommander, with cause, solution and a link to the object.
- Mute and Resolved give findings a lifecycle, complementing the alert list.
- Volume is not urgency: filter by severity and type, and start with the 9 Critical items before the 145 Notice ones.
- Insights and Alertmanager work together. Insights organizes the review inside Kommander; Alertmanager, with a real destination, notifies people outside it.
NKP Insights checklist
- S3 storage available (Rook Ceph Cluster, Nutanix Objects or another S3)
- CloudNativePG enabled in the workspace
- Insights enabled in each workspace, picking the clusters
- Insights pods checked (
backend,forwarder,resolution-cm,postgresql) - Critical and Warning findings reviewed on day one
- Intentional findings marked Muted, with a justification
- Periodic review of Security and Best Practices findings
- NKP edition confirmed with Nutanix
What I haven’t tested yet
- NKP Insights notifications outside Kommander. In the lab, I followed the findings on the Insights page and did not verify external delivery.
- Insights outbound traffic. I did not run a network analysis; for regulated environments, that is the next step.
- Other NKP editions. The lab runs NKP Ultimate; I have not tested Insights on another edition.
Next part
In Part 3, the OpenTelemetry Operator: instrumenting a Python application without touching its code, seeing traces in Jaeger and metrics in Prometheus, and going from a trace to its log in one click.
References
Nutanix
- Nutanix Kubernetes Platform Guide 2.19, NKP Insights section (Nutanix portal)
Projects and community
Comments
Comments use GitHub Discussions; you need a GitHub account.